01月03日 > 火曜
GOOG TEVA
Swing Scan のボタンの意味
Swing Scan: Explanation On Each
Button
CQGのコンディションマクロを利用し、ガイドラインを表示する機能と、ブレイクアウトを検出する
ブレイクスキャンシステムを組み合わせたシステムでマーケットをWATCH。
Gapper's Eye uses the original macro program designed by daytradenet.com
for the CQG chart system.
This system shows
the support and resistance lines as well as the Quattro Setup Zone.
ブレイクスキャンシステムはメンバーズサービスとして有料で提供している
。
The Break Scan System is provided as one of the Daytradenet members
services.
神風ギャッププレイがついに米国で紹介!
The Kamikaze Gap Play
was introduced to the U.S. traders in Active Trader Magazine.
The U.S.
stock market opens at
23:30 in Japan.
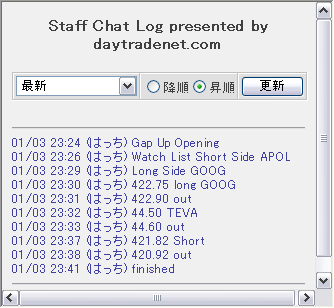
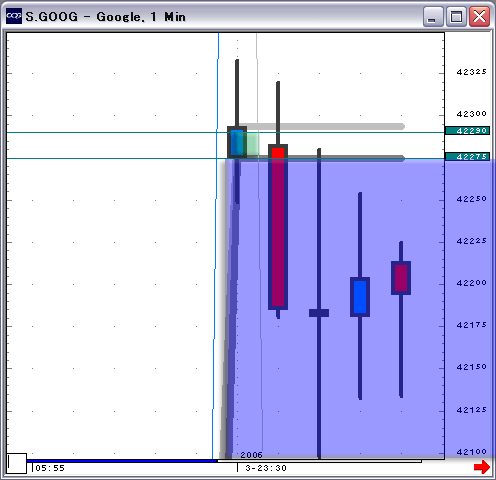
01/03 23:30 (はっち) 422.75 long GOOG
01/03 23:31 (はっち) 422.90 out
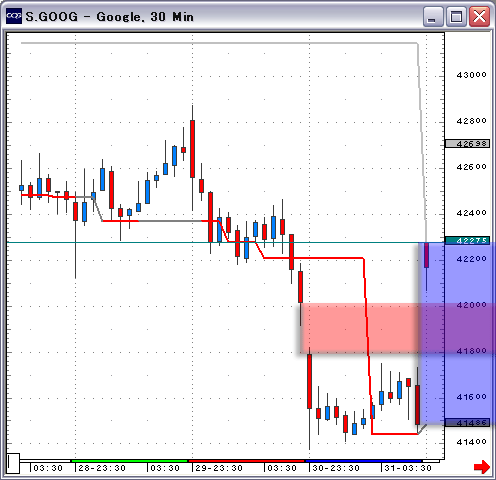
ギャップが大きすぎるのが問題。
The size of the gap is too big.
下の30分チャートでは前日のギャップは埋めている。
As you can see below on the 30-minute chart, the prior day's gap has been
filled.
だが、単なる前日の高値ブレイクの位置から始まっているだけだ。
It just opened above the previous day's high.
大きなゲインは狙えないパターンだ。
This is not a kind of pattern you can expect a big gain.
01/03 23:32 (はっち) 44.50 TEVA
01/03 23:33 (はっち) 44.60 out
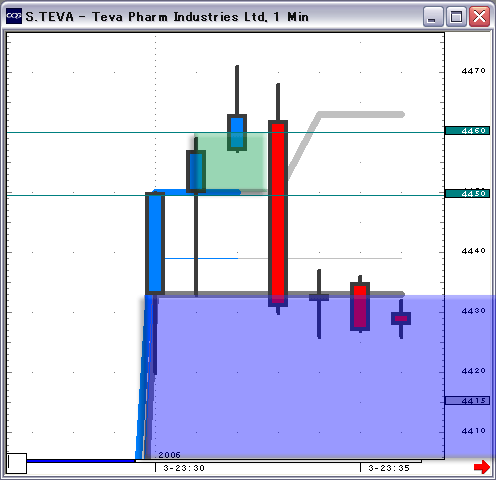
3本のローソク足で上昇が終わっている。
The upward momentum was gone after three consecutive up bars.
狙える値幅はこれが限度だろう。
This was probably as much as you could get from this issue.
GOOGだと難しいが、この銘柄なら脱出にはトレーリングストップを使った方がいいだろう。
Use the trailing-stop to close the position. The trailing-stop is not
suitable on GOOG.
01/03 23:37 (はっち) 421.82 Short
01/03 23:38 (はっち) 420.92 out
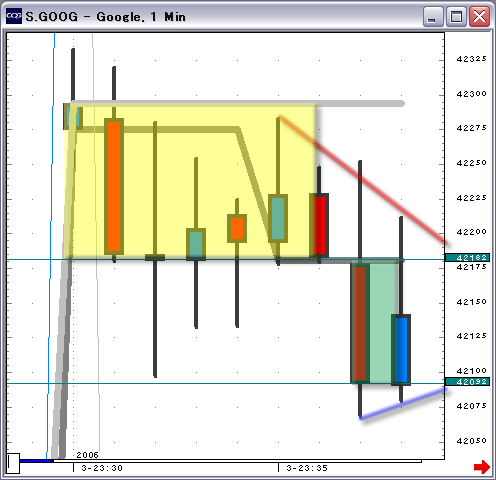
ガイドラインを見ると、灰色になっているため、1分足での明確なトレンドのないゾーンだ。
The gray line means there is no clear trend on the 1-minute chart.
つまりギャップにもぐった位置は、そこでの買い手あるいは売り手のパニックを採りやすい場所でもあるのだ。
It is easier to detect how buyers or sellers panic inside of a gap-zone.
黄色いゾーンにいる買い手がパニックを起こす位置が421.80あたり。
Buyers will be panicked around 421.80 in the yellow-zone.
3分目からのプルバックは、6分目で終了して、再び下落に転じていることがわかるだろう。
As you can see, a pullback started on the third bar was ended at the sixth
bar and proceeded to decline.
ゲインは1ポイント狙いとなったが、キリのいい値段あるいはキリのいい値幅は、脱出やエントリーの決断を早めてくれるだろう。
I was looking for a 1-point profit. By setting a good round number target,
you can decide quickly to execute your trade.
01/03 23:41 (はっち) finished
◆
Hi Lo Band Gap Play Watch
このプレイは近いうちにリリースされるスイングスキャンを使うスイングトレードの手法。
エントリーの方向へ動いた場合マーケットの終わり際に脱出してもOKだ。マーケットの指数をよく見るのがポイントだ。これもあまりにも簡単に勝てるので、欲が出ないように気をつけること。これが唯一の注意点
。具体的なトレード方法の詳細はこちらにあります。We
are releasing the Swing Scan system shortly. As the name implies,
this system is designed to scan candidates for swing trading. If your position moves to the point of
your entry, you can close your position during the market hours.
Be sure to follow the market index closely.
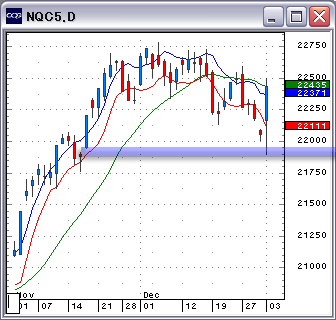
ナスダック総合指数はギャップアップ。
The Nasdaq gapped higher.
さて面白い展開になりそうだ。
It may give us an interesting development.
ホールドしていた銘柄 > Over night positions
なし
No overnight positions.
スイングスキャン銘柄をチェック
Swing Scan Watch
スイングスキャンシステムは2006年1月にサービス開始を予定
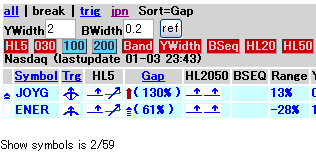
Each figure shows the size of
the gap, the order of moving averages, the new high or new low in the past five
days. The trigger indicates the buying and selling pressure. We do not hold
overnight positions more than five days. A long position will be closed when
the stock gaps down. (Sometimes, the position is liquidated on the second gap-down.)
The opposite rules applies for closing short positions.
項目は右からギャップの厚さ・MAの順番・5日または前日の抵抗線の位置・トリガーの有無。選択予定数は保有中のものがないので最大5銘柄。ルールは買いの場合、ギャップアップでホールド
。ギャップダウンまたは2回のギャップダウンで脱出。ショートは逆。

フィルターのボタンをクリックすると、赤い色に変わり
下記の機能が働いていることを示している。
左から
HL5 > 5日の高値または安値をブレイクしている。
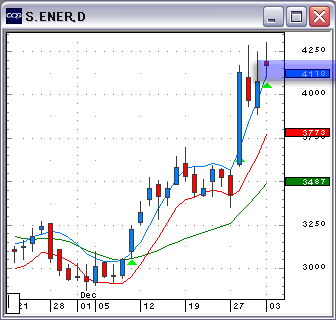
030 > 一日の値幅の30%以上のギャップがある。
100 > 一日の値幅の100%以下のギャップ。
このケースでは機能は働かせていない。
200 > 一日の値幅の200%以下のギャップ。
このケースでは機能は働かせていない。
Band > 20MAと5MAの位置関係が本来の位置にある。
YWidth > 前日のローソク足本体は20日間の平均値の2倍以下。
(このパラーメータは小数点以下まで変更できる)
BSeq > 陽線が3本続いていない。
HL20 > 20日間のローソク足本体の抵抗線をブレイクした置から
始まっている。
HL50 > 50日間のローソク足本体の抵抗線をブレイクした置から
始まっている。
When you click the button, its color changes to red.
Let me explain from the left.
HL5: It shows the 5-day high/low.
030: The gap size is bigger than 30% of the average daily range.
100: The size of the gap is less than 100% of the average daily range. (In
this case, this function is not applied. Notice, the background is not red.)
200: The size of the gap is smaller than 200% of the average daily range.
(It is not on.)
Band: The 20-dayMA and the 5-MA are lined up properly.
YWidth: The size of the prior day's real body is smaller than twice its
2-day average. (Fractional numbers can be used.)
Bseq: No three consecutive up bars.
HL20: Opening above a 20-day resistance line. (The resistance line is based
on real bodies, not including shadows.)
HL50: Opening above a 50-day resistance line. (The resistance line is based
on real bodies, not including shadows.)
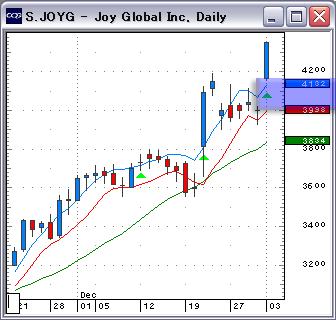
あえてこの2銘柄をロング。
さてどうなるか?
It may be daring, but I decided to buy two stocks today. Are they going to
work out?
New Year Special Issue
I have been watching your plays daily
and getting a good feel for your playing style. The translation for Gappers
Eye is great and has been helping me a lot. Yes, not a good market recently
for Hi Lo Band Gap plays.
Your daily plays on goog have been excellent. To make so much money in the
first few minutes of the market is excellent.
Break Scan is an excellent tool…
I have been taking many notes of the tool and this is what I understand so
far.
Break Scan selects around 30 stocks. Top 20 high volume stocks and the Top
10 most active Nasdaq stocks on a given day. They must all be trading a
million shares or more. They have to also be trading at $30 or higher.
A double setup is when on the 1 min chart is breaks the 20MA, or on the 15
min chart it breaks the 200MA? (This one is am unsure of? 3 min chart breaks
the 200MA?)
A Triple set up is when the price opens higher than the previous close or
opens below the previous close, gapped lower.
A Quatro set up is when it breaks the opening. You show it testing the entry
and then the break. You give the break price and enter the trade.
(A couple things I was unclear about, you have a step up and a step down. I
believe these indicate that you are below or above the two moving averages
that you are looking at?)
Lastly, you have Full arrow and Broken arrows and I am not sure what those
are indicators of?
Anyway, breakscan allows the entry level trader to jump in when it breaks
and sell once you get a reversal candle. Wow, what an easy system.
Execution of the trade is where I find it difficult. You have only 3 minutes
or less to pull the trigger and get your order executed. Then maybe one
minute later you exit the trade. I found that by looking at Breakscan, and
setting the entry, I would always be too late in the trade. There is a lot
of skill involved in this execution. How many trades can you simultaneously
execute?
I have been watching your work on Swing Scan as well. Swing Scan is a little
easier to follow. You again have the moving averages (not sure the moving
averages you use here), look at new highs or new lows for 5 days, and have a
trigger indicator (counting ticks in the market?)
You now have new indicators of Bwidth (Candle Stick length), stricter gap
rules (30, 100, 200) Not sure what Ywidth is?
It overall is a great trading system with strict rules to obey.
I am looking forward to the New Year when a lot of new money goes into the
market.
Thanks for all of your help.
毎日ギャッパーズアイを見ています。馬渕さんの手法が、だいぶ分かってきたような気がします。GOOGの売買は素晴らしいですね。最初の数分間で高利益、見事です。
Break Scan はトレードに大きく役立ちます。毎日メモをとりながら使っていますが、私なりに理解できたことを要約します。
ブレイクスキャンは約30ほどの銘柄を選択する。30銘柄の内容は、ナスダックの最も出来高の多い上位20と、モーストアクティブの上位10。さらに銘柄の出来高は100万株以上あり、株価も30ドル以上のものに限定される。
ダブルセットアップの詳細は、まだよく分からないが、1分チャートの20MAブレイク、そして15分チャート、または3分チャートで200MAをブレイクしたものと思われる。
トリプルセットアップは、株価が前日の引値より高く、または低くスタートすることと思われる。
クワトロは寄付きのブレイクアウトと思われる。先ずスキャンにはTESTINGと表示され、次にBREAKとしてエントリー値が表示される。(階段マークの意味が分からない。これは二本の移動平均線と株価の位置を見るものだろうか。)
完全な矢印と、欠けた矢印があるが、このマークの意味がまだ分からない。
とにかくブレイクスキャンは、株価のブレークで買い、そして反転ローソク足での売りを表示してくれるため、初心者に分かりやすいシステムだと思う。
私にとって難しいのは、トレードの執行です。実際にシグナルが出され、そしてオーダーを完了させるまでの時間は3分以下です。早い場合は、1分以内にポジションを処分することもあります。ブレイクスキャンを見ながらエントリーの値段を決めますが、どうしてもエントリーが遅れてしまいます。オーダー執行には、多くの技術が必要な感じがします。馬渕さんは、同時に何銘柄をエントリーするのですか。
スイングスキャンも見ていますが、こちらの方が分かりやすいです。どのMAかは分かりませんが、複数の移動平均線、5日間の高値/安値、それとトリガーでタイミングを見ます。(トリガーはティックをカウントしているのですか)
Bwidthともっと厳選されたギャップルール(30、100、200)ができたようですね。Ywidthの意味が分かりません。厳しいルールが採用されたので、全般的には優れたシステムだと思います。
新年マーケットには、多額の資金が流入することを願っています。今まで色々と助けていただき、本当に感謝します。
ブレイクスキャンでの監視対象銘柄は、ティック数と、一日に動く値幅の20日間の平均値をもとに、ブレイクスキャンを使うためにメンバーズクラブと契約されると、その詳細を見ることができます。
The Break Scan focuses on issues with high numbers of tick and the 20-day
average traveling range of stocks. The details are described on the members club
page.
ダブルセットアップとは、ロングサイドの場合、15分足の200MAと40MAより上に株価がある領域のことです。
For long:
Double setup: The stock opens above both the 40-and the 200-period MA on the
15-minute chart.
トリプルセットアップはこれにギャップアップが加わります。
The Double setup and an upside gap make the triple setup.
クアトロセットアップは、さらに其の前日にギャップアップしていることが条件となります。
The Quatro requires all conditions of the Triple setup and an upside gap two
trading days ago.
階段マークは、3分足の前日のローソク足本体の高値より上に来た場合に、表示されます。
A step-mark appears when the issue trades above the prior day's high on the
3-minute chart.
つまりいきなり階段マークがついたものを優先順位としてチャートで見ると言う使い方を推薦しています。
Focus on stocks with step-marks.
完全な矢印は、株価が始まりの値段より、株価の1%以上動いた位置に来たら表示されます。
A full arrow means the issue is trading more than 1% higher than the opening
price.
オープニングでエントリーする手法では、ブレイクスキャンは使っていません。
I do not use the Break Scan to trade right after the open.
Tradestream を使えば、マーケット開始前の株価がわかるので、あらかじめどれが、階段マークつきかがわかるからです。
By utilizing Tradestream, you can tell which stocks are with step-marks.
昨夜のようなマーケットではテストと表示された銘柄は一応チャートでチェックしています。
The market like last night, I looked up all issues with "test"
indicated.
これは自分が見落とした銘柄がブレイクアウトしてしまっている、というストレスを下げる意味で、とても効果があります。
This helps me to find out all stocks before breakouts.
執行はリミットオーダーで、脱出するときはトレーリングストップを使いますが、GOOGのような銘柄はリミットオーダーです。
I open positions with limit orders and exit with trailing-stops. (I do not
use the trailing-stop on GOOG.)
エントリーは基本的に一銘柄ですが、脱出前に他の銘柄へエントリーするタイミングに出くわすこともありますが、そういうときのすでにエントリーしている銘柄に対しては、トレーリングストップを使います。
Basically, I execute one trade at a time. I sometimes open a new position
while I am closing the existing position. But, this exiting is done by
already placed the trailing-stop.
執行技術は慣れの問題ですから、だれでも数をやればうまくなるはずです。
Trade execution will improve as you
get more experience.
スイングスキャンについては、今日の解説でそれぞれのボタンがどういう役割かは、大体お分かりになったと思います。
I hope you understand the basic function of each button on the Swing
Scan.
マーケットは強く反転したようですが、明日はギャップアップして欲しいものです。(笑)
The market strongly reversed to the
upside. I am looking forward to see a gap-up opening tomorrow.
Gapper's Eye Index
Daytradenet Top
赤とブルーの半透明のゾーンは、前日とのギャップを示し
グリーンの半透明のゾーンは、利益ゾーンを示しています。
Red and blue zones show the gap of the preceding
day.
The Green zone indicates the profitable zone of
trading.