01月20日 > 金曜
RHAT GOOG
ハイローバンドはノーエントリー
High - Low Bands: No New
Signals
CQGのコンディションマクロを利用し、ガイドラインを表示する機能と、ブレイクアウトを検出する
ブレイクスキャンシステムを組み合わせたシステムでマーケットをWATCH。
Gapper's Eye uses the original macro program designed by daytradenet.com
for the CQG chart system.
This system shows
the support and resistance lines as well as the Quattro Setup Zone.
ブレイクスキャンシステムはメンバーズサービスとして有料で提供している
。
The Break Scan System is provided as one of the Daytradenet members
services.
神風ギャッププレイがついに米国で紹介!
The Kamikaze Gap Play
was introduced to the U.S. traders in Active Trader Magazine.
The U.S.
stock market opens at
23:30 in Japan.
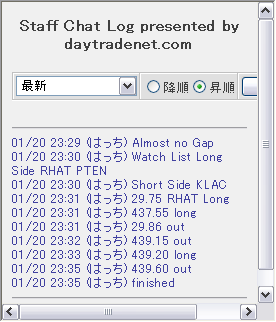
01/20 23:31 (はっち) 29.75 RHAT Long
01/20 23:31 (はっち) 29.86 out
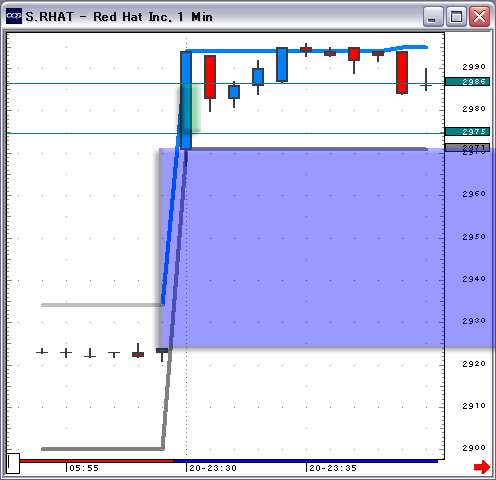
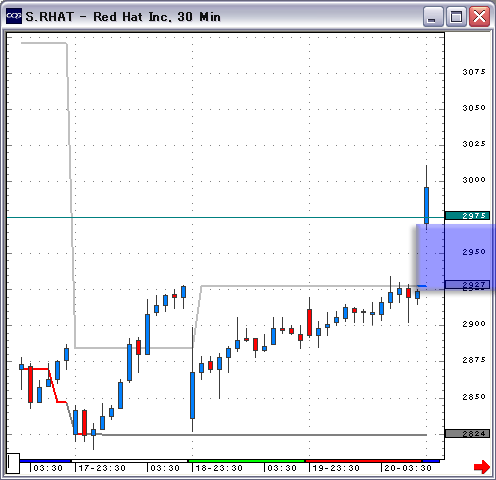
30分チャートが最もよかったRHAT。
だがあまり上がらない・・
RHAT had a nice 30-minute chart pattern, but it did not go up as much as I
expected.
01/20 23:31 (はっち) 437.55 long
01/20 23:32 (はっち) 439.15 out
01/20 23:33 (はっち) 439.20 long
01/20 23:35 (はっち) 439.60 out
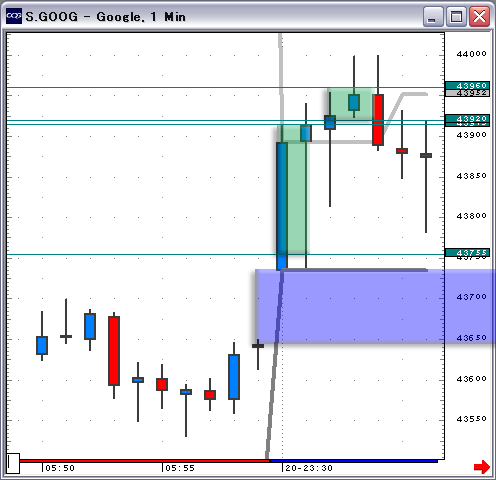
トレンドのないところで、オーバーシュート狙い。
GOOGはいきなりリバーサルにならなければ、これくらいはオーバーシュートする。
30分チャートを見ると、リバーサルパターンだけどね。
GOOG was inside of the trendless
zone, so I decided to focus on the overshoot. It is common for GOOG to move
this much as long as it does not make a quick reversal. Notice the 30-minute
chart was forming a reversal pattern.
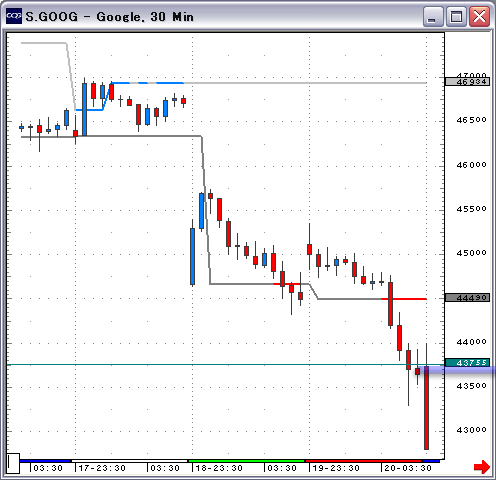
01/20 23:35 (はっち) finished
◆
High - Low Bands Gap Play Watch
このプレイは近いうちにリリースされるスイングスキャンを使うスイングトレードの手法。
エントリーの方向へ動いた場合マーケットの終わり際に脱出してもOKだ。マーケットの指数をよく見るのがポイントだ。これもあまりにも簡単に勝てるので、欲が出ないように気をつけること。これが唯一の注意点
。具体的なトレード方法の詳細はこちらにあります。We
are releasing the Swing Scan system shortly. As the name implies,
this system is designed to scan candidates for swing trading. If your position moves to the point of
your entry, you can close your position during the market hours.
Be sure to follow the market index closely.
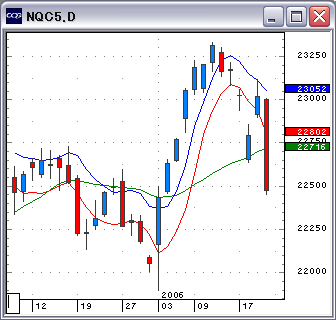
ナスダック総合指数はギャップダウンで開始。
The Nasdaq index gapped down on the open.
ホールドしていた銘柄 > Over night positions
陽線3本のあとでさらに、ナスダックがギャップダウンしたので手仕舞い。
I closed the position. The Nasdaq gapped down, and the stock formed three
straight up-bars.
58.90 break Even
+-0point
陽線3本のあとでナスダックがギャップダウンしたのでこれも手仕舞い。
I exit the position. The reason was same as the above.
43.60 to 44.10
+0.5point
ワイドレンジバーのあとでナスダックがギャップダウン
これも手仕舞いだ。
I closed this position. The Nasdaq opened lower after the stock shaped a
wide range bar.
34.30 to 35.50
+1.3point
朝起きてみるとすべて陰線で終了していた。
危ないところだった。
When I woke up, I found all stocks finished down. It was a close call.
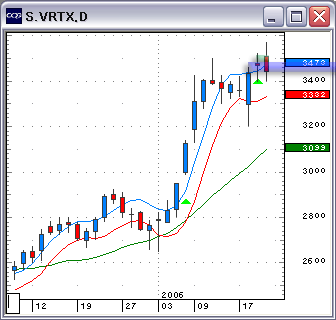
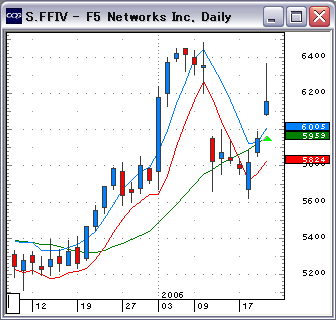
スイングスキャン銘柄をチェック
Swing Scan Watch
スイングスキャンシステムは2006年1月にサービス開始を予定
Each figure shows the size of
the gap, the order of moving averages, the new high or new low in the past five
days. The trigger indicates the buying and selling pressure. We do not hold
overnight positions more than five days. A long position will be closed when
the stock gaps down. (Sometimes, the position is liquidated on the second gap-down.)
The opposite rules applies for closing short positions.
項目は右からギャップの厚さ・MAの順番・5日または前日の抵抗線の位置・トリガーの有無。選択予定数は保有中のものがないので最大5銘柄。ルールは買いの場合、ギャップアップでホールド
。ギャップダウンまたは2回のギャップダウンで脱出。ショートは逆。
ナスダック総合指数がギャップダウンなのでエントリーはせず。
No entry. The Nasdaq gapped down on the open.
陽線2本のあとで、MAの並び順も悪い。
The issue made two consecutive up-days. Moving averages are not lined up
correctly.
手仕舞いした銘柄。
I exit this position.
よい週末をお過ごしください。
Have
a nice weekend !
Gapper's Eye Index
Daytradenet Top
赤とブルーの半透明のゾーンは、前日とのギャップを示し
グリーンの半透明のゾーンは、利益ゾーンを示しています。
Red and blue zones show the gap of the preceding
day.
The Green zone indicates the profitable zone of
trading.