6/14/2006 Wed
Closing All Positions
Gapper's Eye uses the original macro program designed by daytradenet.com
for the CQG chart system.
This system shows
the support and resistance lines as well as the Quattro Setup Zone.
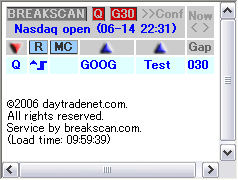
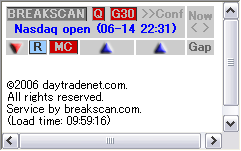
The Break Scan System is provided as one of the Daytradenet members
services.
The Kamikaze Gap Play
was introduced to the U.S. traders in Active Trader Magazine.
The U.S market will be closed on May 29
because of Memorial Day.
The U.S.
stock market opens at
22:30 in Japan. (summer Time)
This pattern is easy to understand.
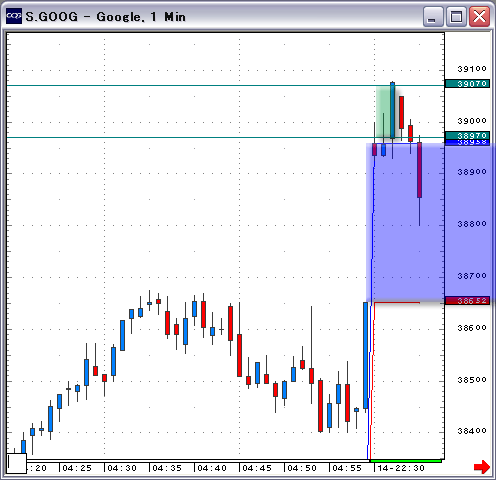
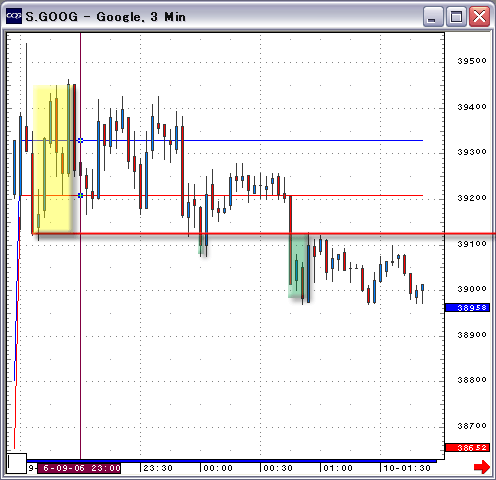
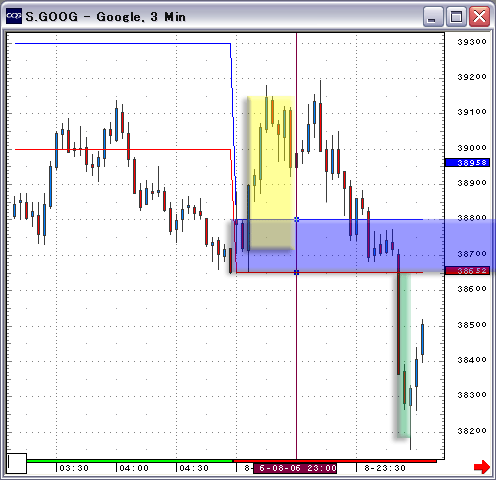
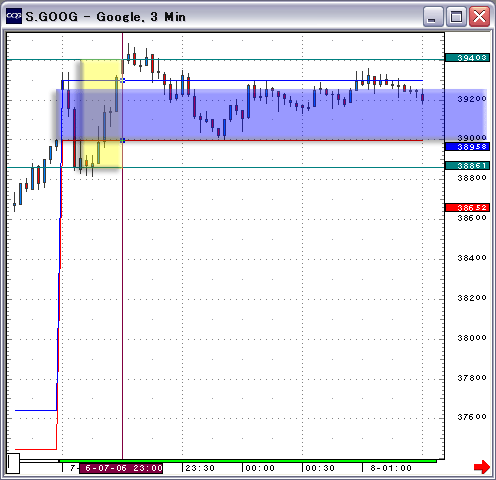
GOOG is highly liquid and gives us good price ranges. It is an ideal stock
to day trade.
Let's review a high probability method, the 30-minute gap play.
GOOG
The 30-minute gap play
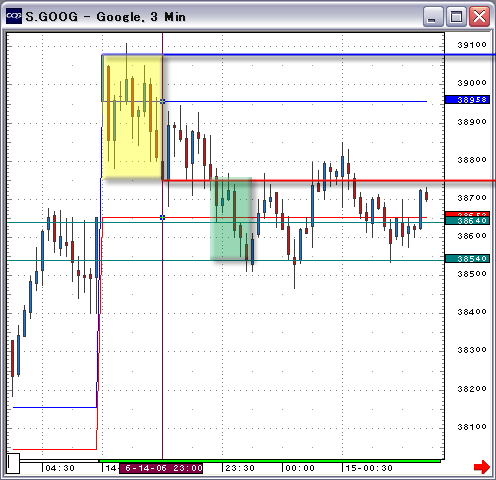
You don't have to wait till the stock to move out of the gap. You can trade
as soon as the issue moves out of the 30-minute long yellow zone. This is
one of the high probability plays.
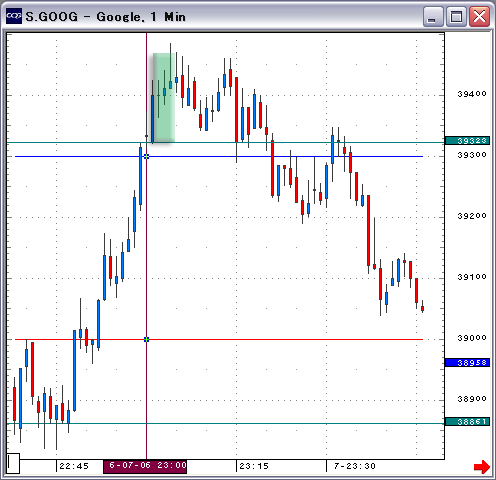
The blue line and red line indicate gaps on the 1-minute chart. You can
trade twice when the stock enters and exits the gap.
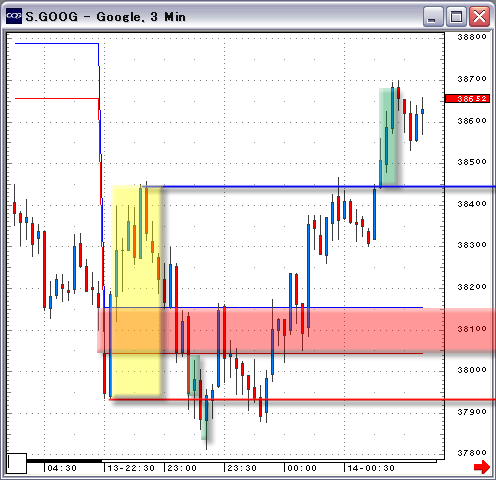
This one is from the 13th. Wait for
30 minutes to confirm the range. As soon as the stock moves out of the range,
you can short the issue.
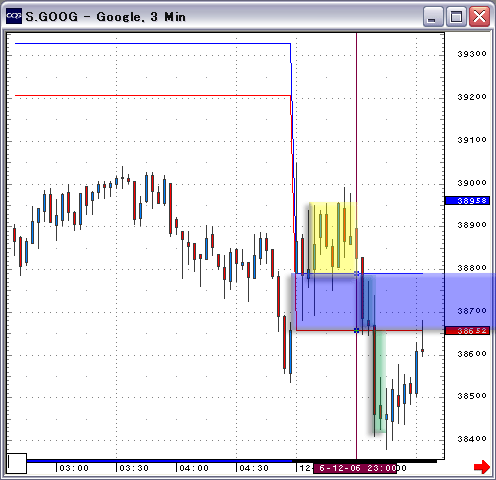
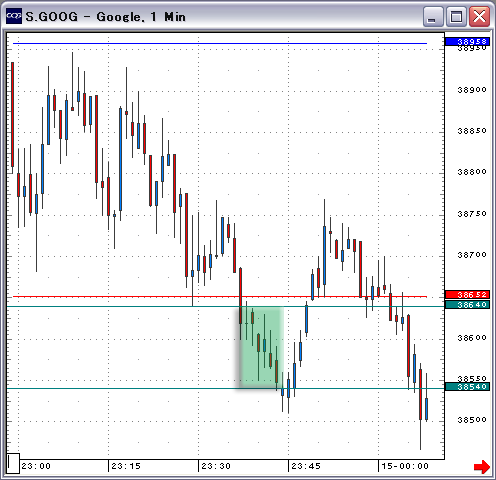
From the 12th.
(1-minute chart)
↓
This is all for now. Review as many charts as you can to get nuances.
I used to trade only this strategy
long time ago.
Of course, I am now combined this strategy with new tools.
30-Minute Magic Cross Gap Play
This is a daytrading strategy utilizing the Swing
Scan (available soon). Our goal is to take one bar worth of profit
on the 30-minute chart. Just by using the Swing Scan, you can play
both swing and intraday trading.
The Breakscan Pro comes with the 30-minute Magic Cross.
None
High - Low Bands Gap Play Watch
We
are releasing the Swing Scan system shortly. As the name implies,
this system is designed to scan candidates for swing trading. If your position moves to the point of
your entry, you can close your position during the market hours.
Be sure to follow the market index closely.
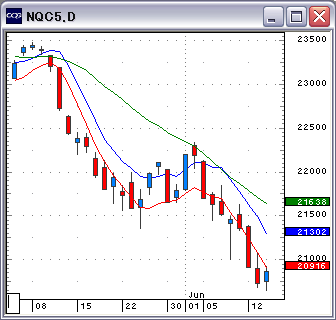
The Nasdaq opened higher. It looks ready to reverse after three consecutive
down bars.
Swing Scan Watch
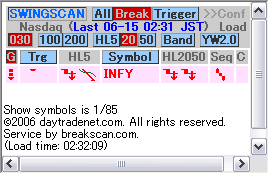
Each figure shows the size of
the gap, the order of moving averages, the new high or new low in the past five
days. The trigger indicates the buying and selling pressure. We do not hold
overnight positions more than five days. A long position will be closed when
the stock gaps down. (Sometimes, the position is liquidated on the second gap-down.)
The opposite rules applies for closing short positions.
Over night positions
The Nasdaq opened higher. It looks ready to reverse after three consecutive
down bars. I closed all short positions.
Closed
Closed
Closed
The Nasdaq opened higher. It looks ready to reverse after three consecutive
down bars. I closed all short positions.
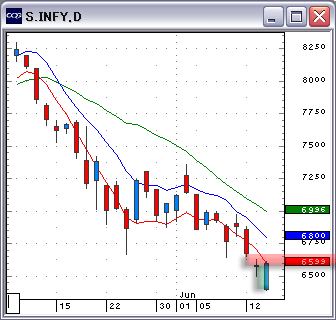
Gapper's Eye Index
Daytradenet Top
Red and blue zones show the gap of the preceding
day.
The Green zone indicates the profitable zone of
trading.