1/5/2007 Fri
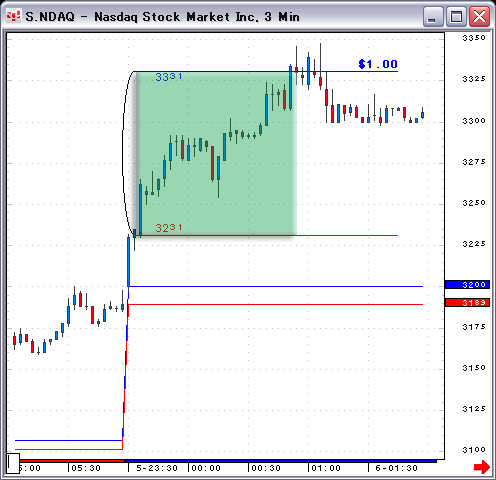
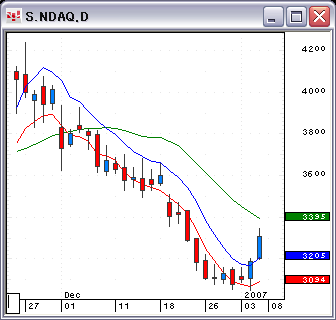
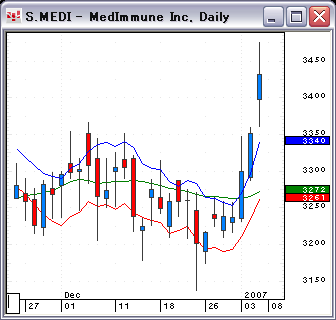
Trade Of The Day: NDAQ And MEDI
High - Low Bands: Taking Profits
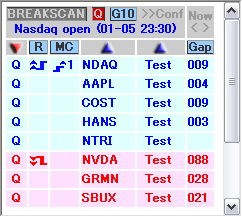
Gapper's
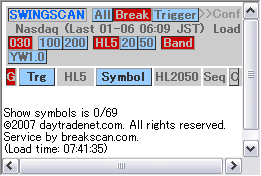
Eye utilizes our original unique stock scanner, Break Scan, and sophisticated
chart software, CQG. With nominal fee, the Break Scan is available to our
members.
The Kamikaze Gap Play
was introduced to the U.S. traders in the
August 2005 issue of Active Trader Magazine.
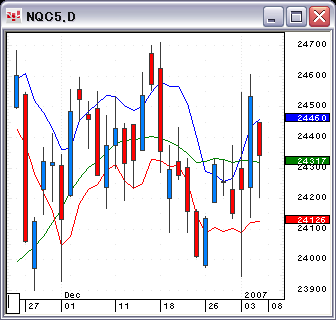
The index gapped down on the open. This was expected after yesterday's wide
range bar.
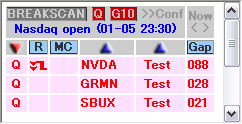
Choose stocks show up on both the Swing Scan and Break Scan Pro.
None.
Let's loosen up moving average
restrictions !
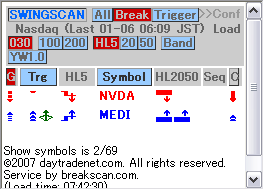
Choose stocks show up on both the Swing Scan and Break Scan Pro.
This was the only good looking
daily chart I could find before the open.
30 - Minute gap play
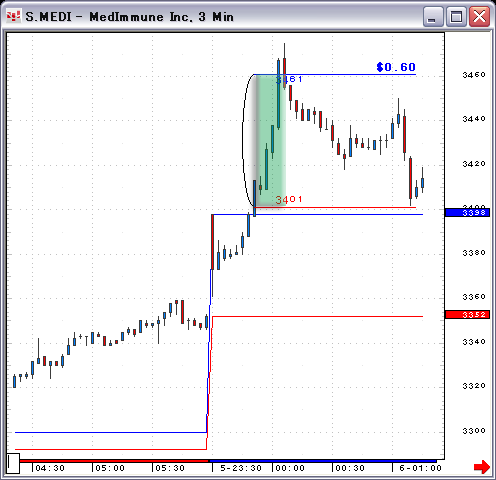
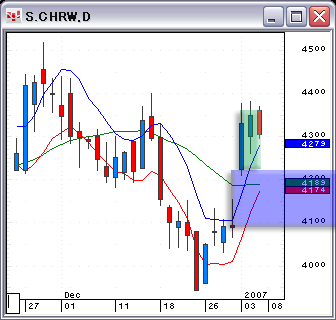
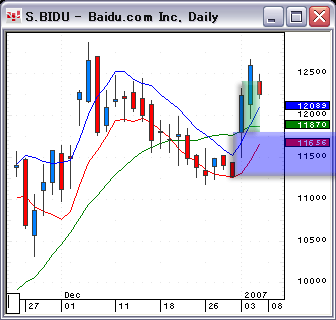
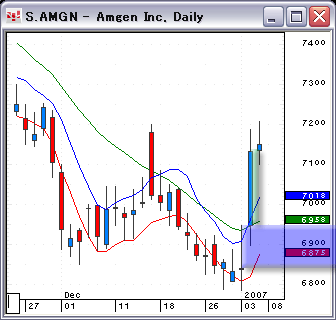
High - Low Bands Gap Play Watch
This strategy can be applied effectively by using the
Swing Scan. As the name implies, this system scan stocks for
swing trading. Of course, these stocks are suitable for intraday
trading, too. Don't just concentrate on stocks. Be sure to follow
the index.
The index gapped down on the open.
This was expected after yesterday's wide range bar. This is time to take
profits.
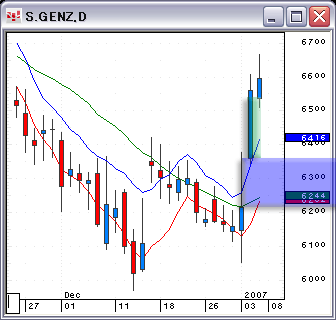
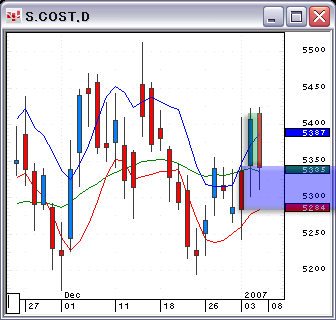
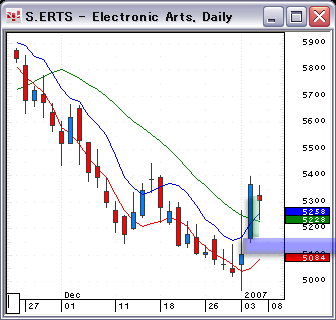
Swing Scan Watch
Each figure shows the size of
the gap, the order of moving averages, the new high or new low in the past five
days. The trigger indicates the buying and selling pressure. We do not hold
overnight positions more than five days. A long position will be closed when
the stock gaps down. (Sometimes, the position is liquidated on the second gap-down.)
The opposite rules applies for closing short positions.
None.
So, it's better to remove MA restrictions.
Too many consecutive up days.
Existing positions
It's time to take profits.
42.7 to 43.0
+0.3point
115.8 to 121.5
+5.7point
69.2 to 71.9
+2.7point
63.8 to 66.3
+2.5point
53.4 to 53.9
+0.5point
51.8 to 53.2
+1.4 point
Have a
nice weekend !
Gapper's Eye Index
Daytradenet Top
Red
and blue zones show the gap of the preceding day.
The Green zone indicates the profitable zone of
trading.