4/12/2007 Thu
Trade of the Day: MEDI
Intraday
Trading With Hatch #3
Gapper's
Eye utilizes our original unique stock scanner, Break Scan, and sophisticated
chart software, CQG. With nominal fee, the Break Scan is available to our
members.
The Kamikaze Gap Play
was introduced to the U.S. traders in the
August 2005 issue of Active Trader Magazine.
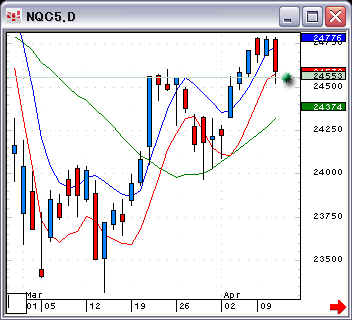
The NASDAQ opened flat. The green
dot indicates the opening price. The index is in the long zone, but this open
price makes trading a bit harder.
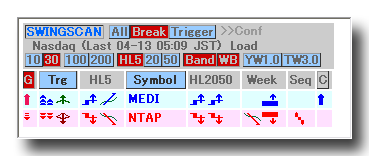
MEDI has a strong weekly trend.
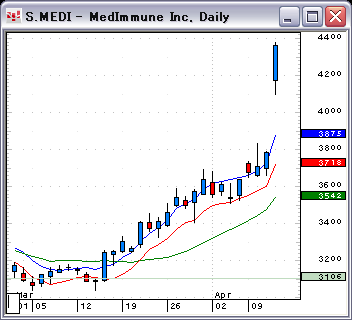
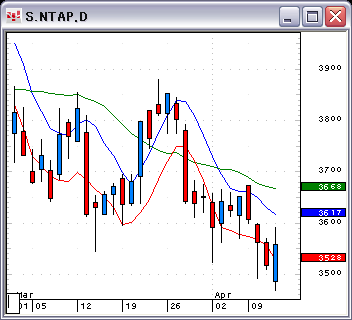
You cannot short NTAP because the index is in the long zone. Look at the
daily chart of NTAP. It has already three consecutive down days.
High - Low Bands Gap Play Watch
This strategy can be applied effectively by using the
Swing Scan. As the name implies, this system scan stocks for
swing trading. Of course, these stocks are suitable for intraday
trading, too. Don't just concentrate on stocks. Be sure to follow
the index.
Swing Scan Watch
Each figure shows the size of
the gap, the order of moving averages, the new high or new low in the past five
days. The trigger indicates the buying and selling pressure. We do not hold
overnight positions more than five days. A long position will be closed when
the stock gaps down. (Sometimes, the position is liquidated on the second gap-down.)
The opposite rules applies for closing short positions.

Why different stocks? Because, they
are not programmed same way.
Hatch #3
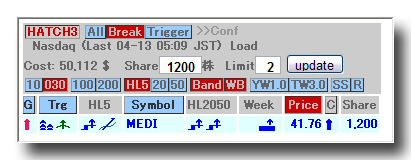
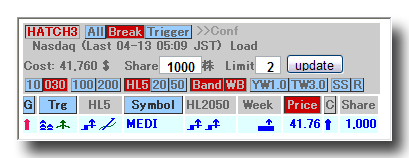
MEDI has a strong weekly trend.
You can buy up to $100,000 with
$25,000 of trading capital. This is enough to cover MEDI trade.
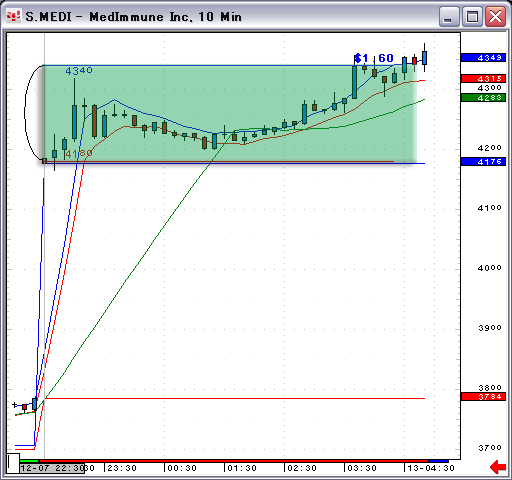
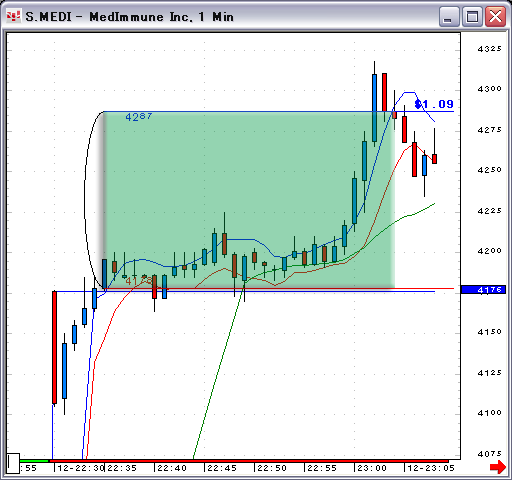
+1.6
Up $1920 with 1200 shares.
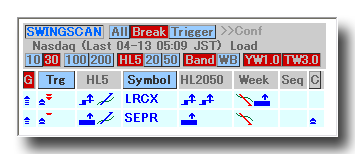
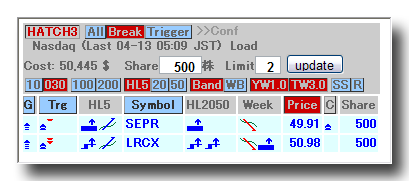
You can get two more stocks if you
remove weekly filter.
Daily charts look good, too.
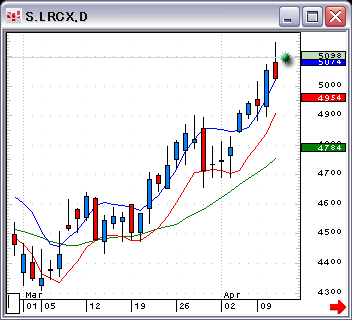
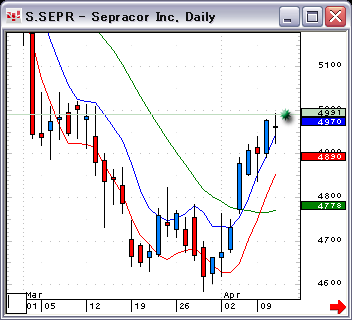
With $25,000 of capital, you
can buy up to $100,000. So, this is enough to trade both stocks.
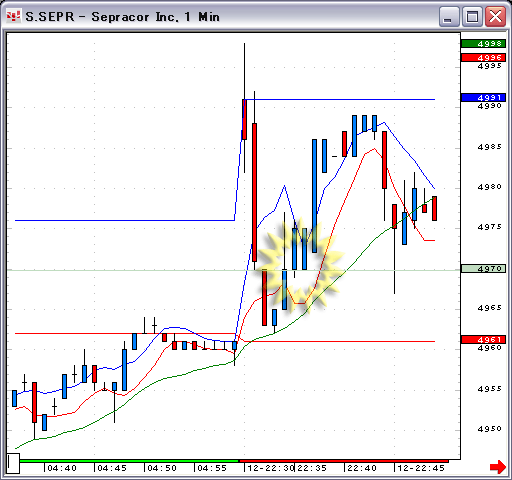
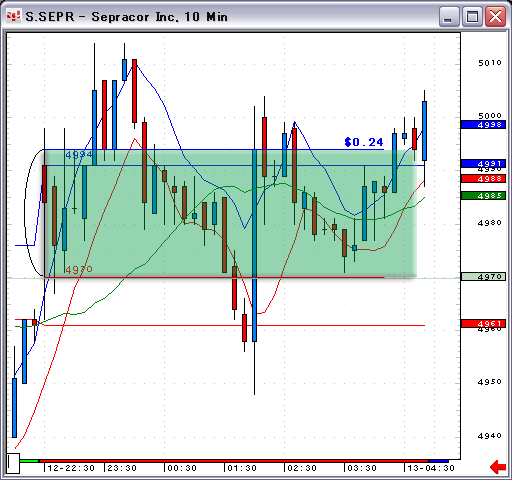
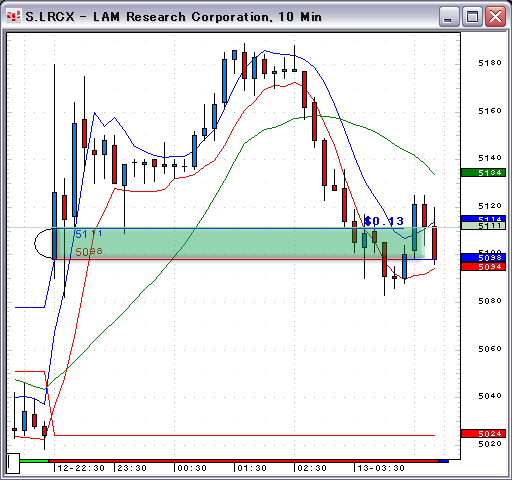

MEDI
+1.6
Up $1600 with 1000 shares.
Total profit of three stocks: $1750
MEDI only
+1.6
Up $1920 with 1200 shares
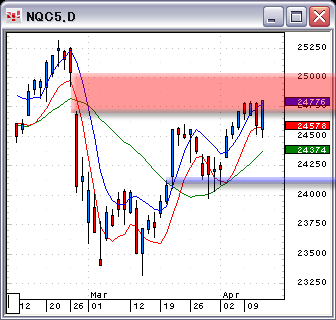
The NASDAQ finished with a long
range up - bar. It is challenging the resistance zone again.
Gapper's Eye Index
Daytradenet Top
Red
and blue zones show the gap of the preceding day.
The Green zone indicates the profitable zone of
trading.