8/13/2007 Mon
Scalping WYNN, VSEA and WFMI
Gapper's
Eye utilizes our original unique stock scanner, Break Scan, and sophisticated
chart software, CQG. With nominal fee, the Break Scan is available to our
members.
The Kamikaze Gap Play
was introduced to the U.S. traders in the
August 2005 issue of Active Trader Magazine.
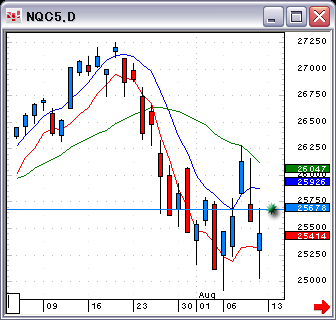
The NASDAQ opened higher as indicated by the green dot.
Excerpts from Net Aid:
2007-08-13 22:30:29 hatch
WYNN long at 113.75.
2007-08-13 22:32:05 hatch
Exit at 115.0.
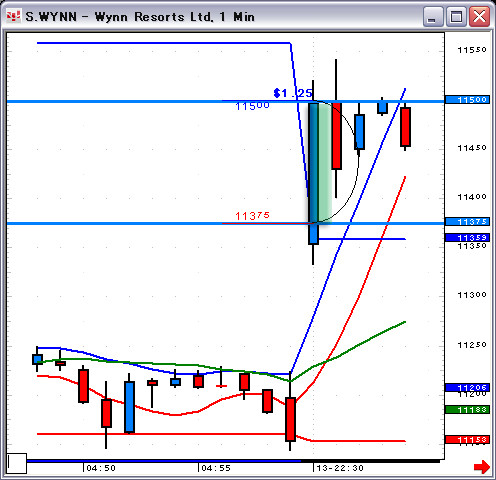
2007-08-13 22:39:28 hatch shadow
By adjusting parameters a bit, you can find a stock like WYNN.
2007-08-13 22:42:53 hatch shadow
VSEA is also a good lower priced candidate.
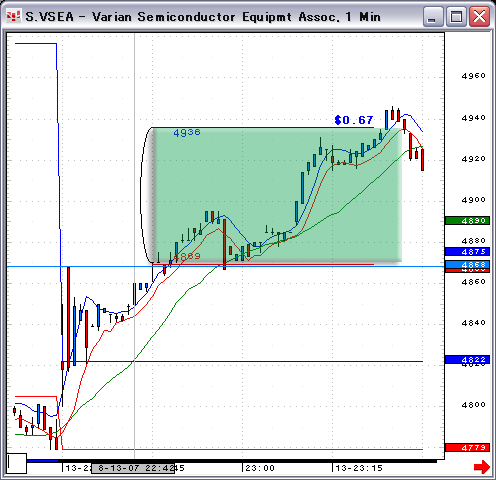
2007-08-13 22:43:16 hatchshadow
The daily chart is not that attractive, but the 1-min. chart is
tradable.
2007-08-13 22:51:58 hatch shadow
WFMI may be bottoming out here.
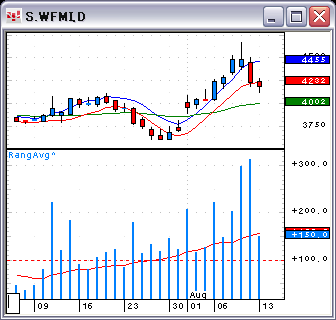
This stock has average daily travel range of 1.5 point. As you
can see below, the stock has already moved 1.5 point, so it has
high probability of bouncing here.
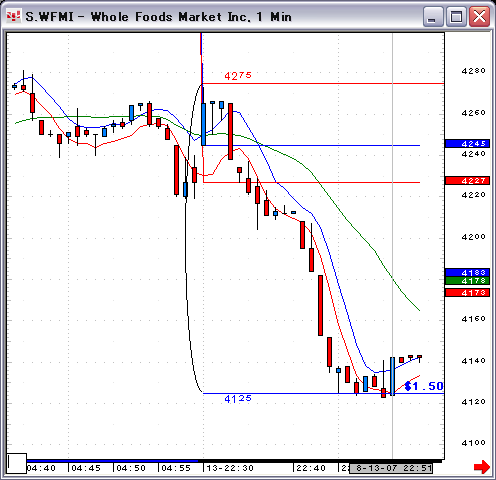
2007-08-13 22:54:13 hatch shadow
Let's apply high - low bands on WFMI 1-min. chart.
2007-08-13 23:00:50 hatch shadow
A pattern like this can give us a good breakout.
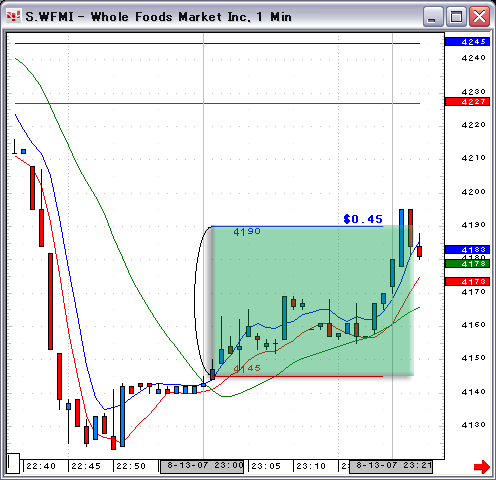
A breakout from a range.
2007-08-13 23:01:51 hatch shadow
WFMI looks ready here.
2007-08-13 23:04:23 hatch shadow
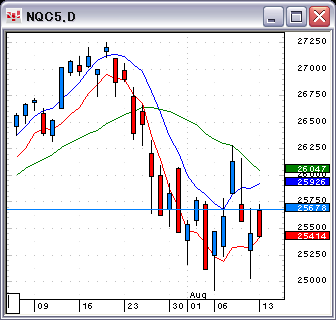
The futures are getting stronger, too.
Total gains: 3.42 points.
The NASDAQ finished the day with a long down bar.
Gapper's Eye Index
Daytradenet Top
Charts courtesy of CQG
Source: 2006 CQG, Inc. All rights reserved worldwide.

Red
and blue zones show the gap of the preceding day.
The Green zone indicates the profitable zone of
trading.