8/24/2007 Fri
Scalping WFMI, APOL and STLD
Gapper's
Eye utilizes our original unique stock scanner, Break Scan, and sophisticated
chart software, CQG. With nominal fee, the Break Scan is available to our
members.
The Kamikaze Gap Play
was introduced to the U.S. traders in the
August 2005 issue of Active Trader Magazine.
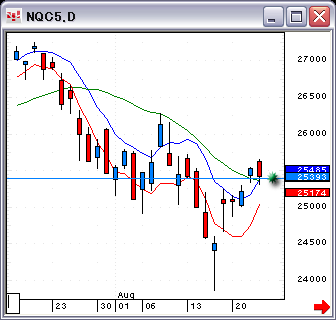
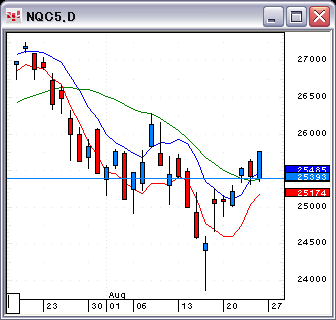
The Nasdaq opened lower as shown by the green dot below.
Excerpts from Net Aid:
2007-08-24 22:04:09 hatch shadow
BIDU and FWLT has gapped down, but they are in up trends. Don't think about
short them !
2007-08-24 22:13:03 hatch shadow
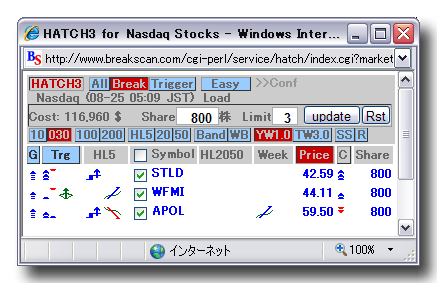
First, check hatch 3. If it does not give us any stocks, move on to Break Scan
Pro, or focus on stocks we have checked earlier.
2007-08-24 22:15:33 hatch shadow
APOL looks ok, but the weekly chart is a bit problem.
2007-08-24 22:15:57 hatch shadow
Considering the weekly chart, WFMI is the best one so
far.
2007-08-24 22:21:49 hatch shadow
Let's focus on APOL, WFMI and STLD today !
2007-08-24 22:30:32 hatch shadow
WFMI is starting to move down.
2007-08-24 22:30:37 hatch shadow
STLD is going up.
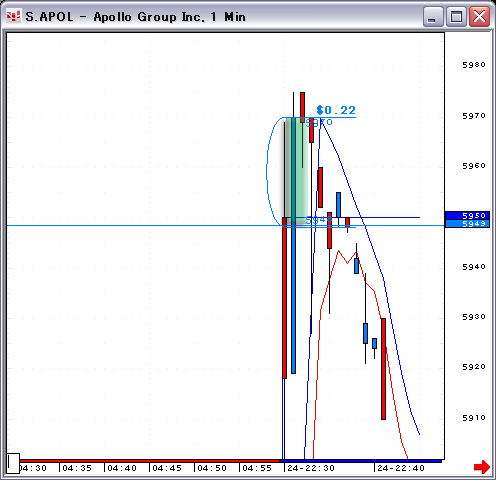
2007-08-24 22:30:58 hatch shadow
Hatch 3 shows no stocks.
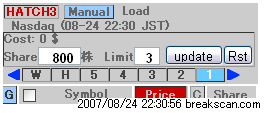
2007-08-24 22:31:25 hatch shadow
VSEA and WFMI are on Break Scan.
2007-08-24 22:32:26 hatch shadow
Both are doing very well !
2007-08-24 22:32:36 hatch shadow
WFMI is already up $440.
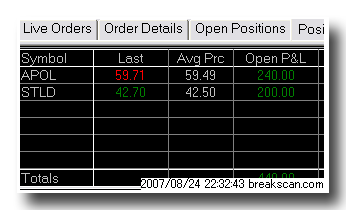

2007-08-24 22:34:21 hatch shadow
Not bad profits at all considering this market condition !
2007-08-24 22:34:32 hatch shadow
WFMI looks promising.
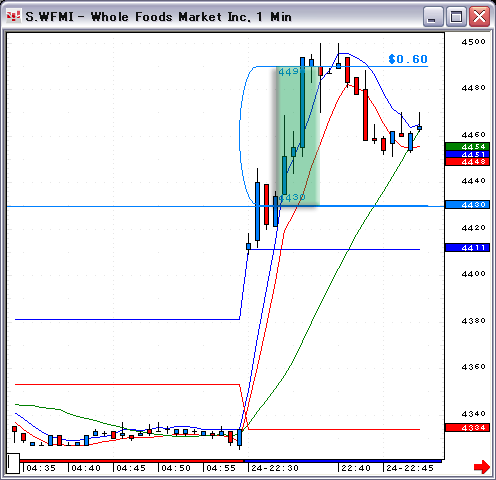
2007-08-24 22:39:03 hatch shadow
The futures are moving higher.
2007-08-24 22:39:35 hatch shadow
STLD is nice. Up $670 !
2007-08-24 22:41:57 hatch shadow
Up $1040 !
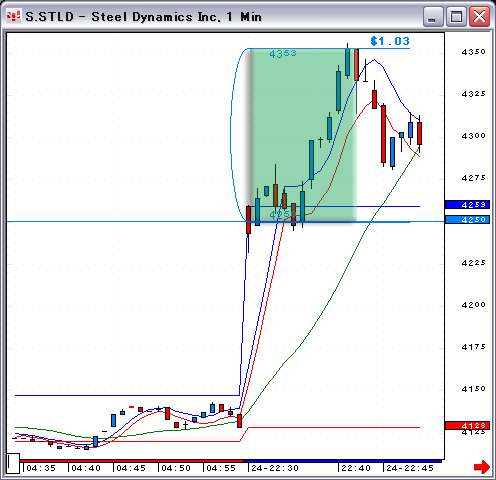
2007-08-24 22:42:25 hatch shadow
Let's take profits.
2007-08-24 22:52:48 hatch shadow
Hatch 3 shows STLD and APOL if loosen parameters.
The Nasdaq formed an up bar.
Have a nice weekend !
Gapper's Eye Index
Daytradenet Top
Charts courtesy of CQG
Source: 2006 CQG, Inc. All rights reserved worldwide.

Red
and blue zones show the gap of the preceding day.
The Green zone indicates the profitable zone of
trading.