9/5/2007 Wed
Scalping BIDU and NVDA
Gapper's
Eye utilizes our original unique stock scanner, Break Scan, and sophisticated
chart software, CQG. With nominal fee, the Break Scan is available to our
members.
The Kamikaze Gap Play
was introduced to the U.S. traders in the
August 2005 issue of Active Trader Magazine.
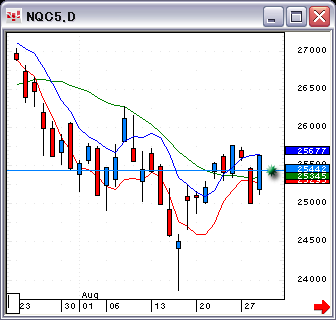
The Nasdaq opened lower as
indicated by the green dot.
Excerpts from Net Aid:
2007-09-05 22:16:22 hatch shadow
Like the Tokyo market, I don't think hatch 3 will show good patterns
today. That means we will be focusing on trades utilizing 1-minute charts.
2007-09-05 22:17:01 hatch shadow
AAPL is #1 trading candidate.
2007-09-05 22:18:22 hatch shadow
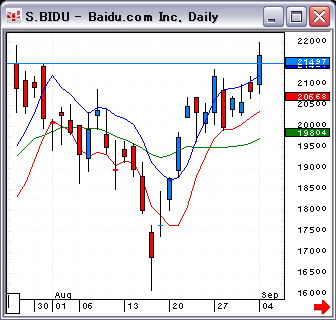
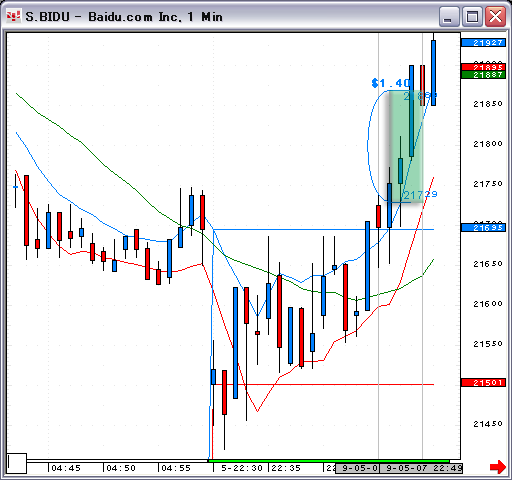
Also pay attention to BIDU. It is gapping down.
2007-09-05 22:18:26 hatch shadow
It recorded a new high, and the weekly chart pattern is improving.
2007-09-05 22:19:19 hatch shadow
If it fills the gap, I think it's going to be interesting.
2007-09-05 22:24:27 hatch shadow
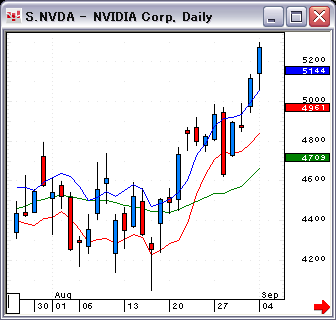
Watch also NVDA
2007-09-05 22:34:29 hatch shadow
NVDA has a small gap, so pay attention to a breakout.
2007-09-05 22:35:00 hatch shadow
The futures are moving sideways.
2007-09-05 22:35:16 hatchshadow
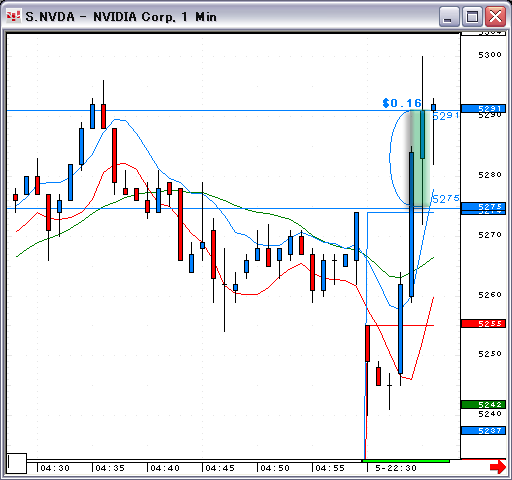
NVDA is breaking out.
2007-09-05 22:35:31 hatch
Long NVDA at 52.75.
2007-09-05 22:36:22 hatch
Out at 52.91.
2007-09-05 22:36:35 hatch shadow
AAPL is making a powerful reversal.
2007-09-05 22:38:22 hatch shadow
NVDA is moving up again.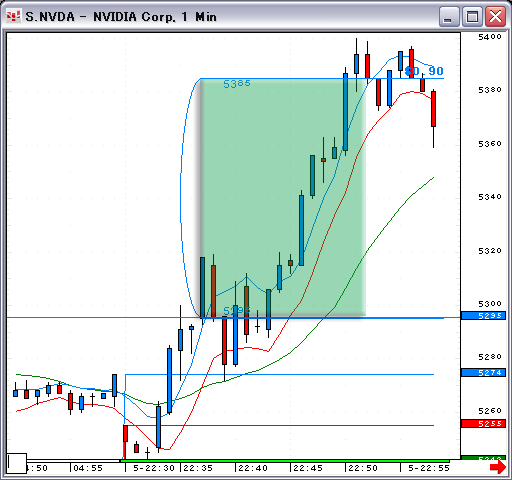
2007-09-05 22:45:11 hatch shadow
BIDU is filling the gap.
2007-09-05 22:48:54 hatch shadow
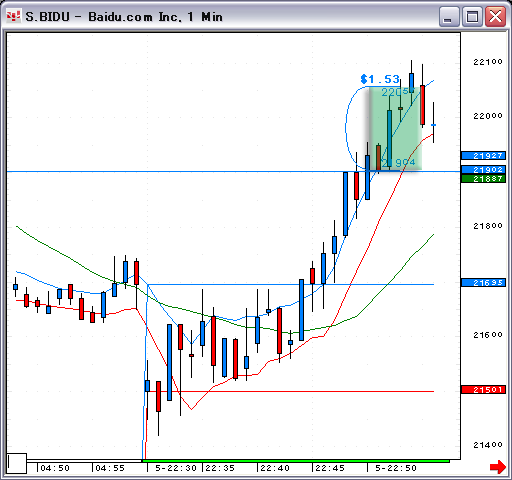
BIDU is on the move.
2007-09-05 22:50:10 hatch shadow
It's time to take profits. Don't be too greedy !
2007-09-05 22:50:58 hatch shadow
BIDU is taking out the high.
2007-09-05 22:51:04 shadow
BIDU looks better than AAPL.
2007-09-05 22:52:47 hatch shadow
Nice, BIDU !
2007-09-05 22:54:48 hatch shadow
BIDU is nearing 210 !
Total from AAPL: +3.2 points
The Nasdaq shaped a down bar.
Gapper's Eye Index
Daytradenet Top
Charts courtesy of CQG
Source: 2006 CQG, Inc. All rights reserved worldwide.

Red
and blue zones show the gap of the preceding day.
The Green zone indicates the profitable zone of
trading.