9/7/2007 Fri
Scalping: SHLD, BIDU and AAPL
Gapper's
Eye utilizes our original unique stock scanner, Break Scan, and sophisticated
chart software, CQG. With nominal fee, the Break Scan is available to our
members.
The Kamikaze Gap Play
was introduced to the U.S. traders in the
August 2005 issue of Active Trader Magazine.
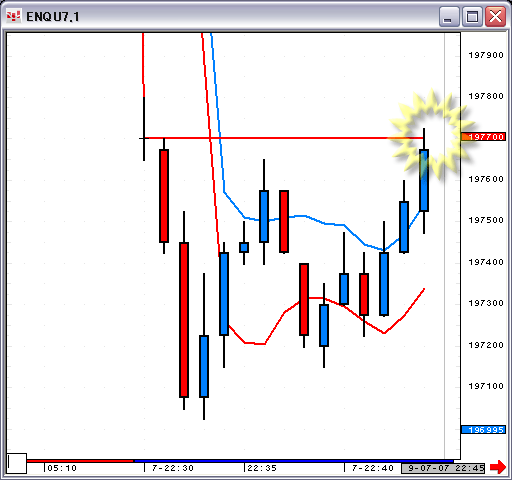
The Nasdaq began the day with a
relatively big downside gap.
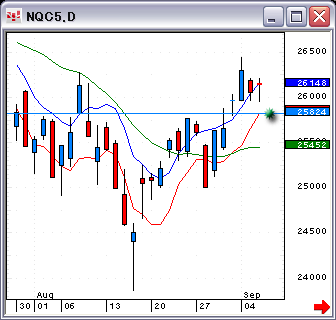
The green dot indicates the open.
Excerpts from Net Aid:
2007-09-07 22:13:19 hatch shadow
Because the market is gapping down big, watch out for a reversal
!
Don't be too hasty! Observe the market
closely.
2007-09-07 22:15:18 hatch shadow
SHLD and CTSH are good short candidates.
2007-09-07 22:15:59 hatch shadow
Be sure to watch BIDU, CELG, DRYS, FWLT, WYNN and AAPL.
2007-09-07 22:19:41 hatch shadow
TEVA is the only long candidate .
2007-09-07 22:24:50 hatch shadow
Wait for uptrending stocks to hit support levels. These are not
counter trend trades.
2007-09-07 22:31:39
hatch shadow
Short SHLD.
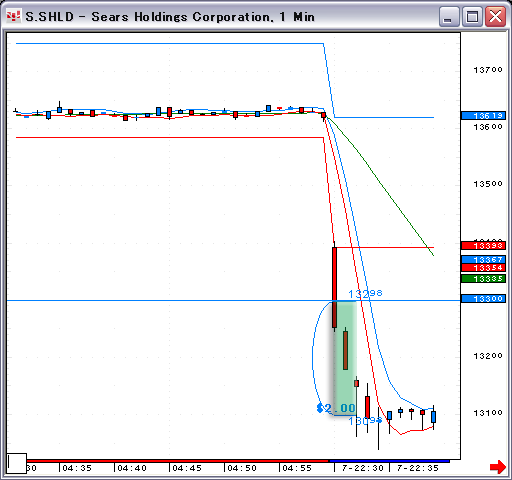
2007-09-07 22:33:37 hatch shadow
Out SHLD.
2007-09-07 22:35:15 hatch
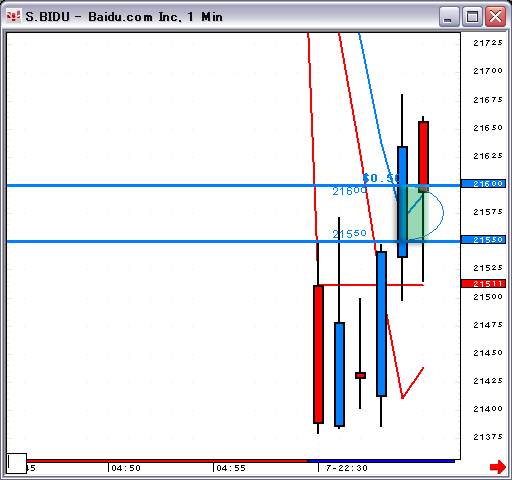
Long BIDU at 215.5
2007-09-07 22:35:33 hatch
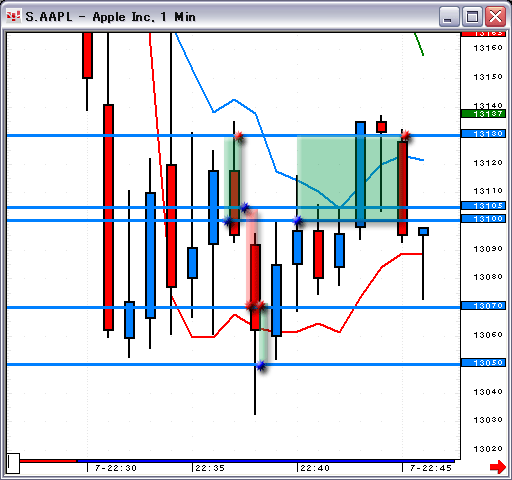
Long AAPL at 131.0
2007-09-07 22:36:10 hatch
Out at 216.0
2007-09-07 22:36:22 hatch
Out at 131.20.
2007-09-07 22:37:03 hatch
Long at 131.0
2007-09-07 22:37:35 hatch
Out at 131.30
2007-09-07 22:37:54 hatch
Long at 131.05
2007-09-07 22:38:59
hatch
Out at 130.70
2007-09-07 22:39:02 hatch
Short at 130.70
2007-09-07 22:39:41 hatch
Out at 130.50
2007-09-07 22:40:58 hatch
Long at 131.0
2007-09-07 22:43:06 hatch shadow
You can short CTSH now.
2007-09-07 22:44:55 hatch shadow
BIDU
2007-09-07 22:45:10 hatch shadow
Long BIDU.
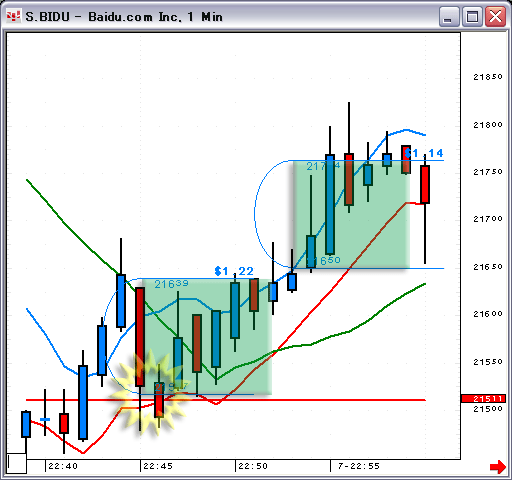
The stock is bouncing off the
lower boundary.
2007-09-07 22:53:59 hatch
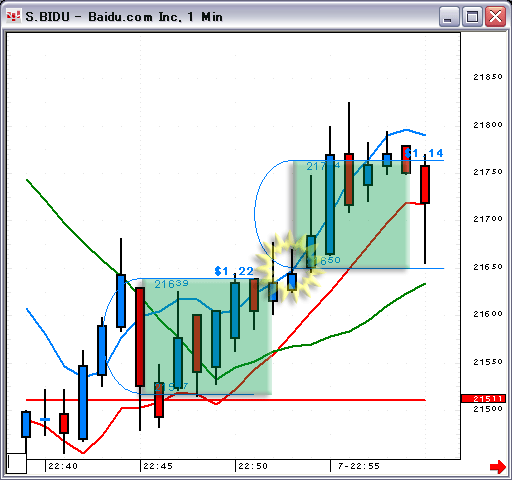
Long BIDU at 216.50.
2007-09-07 23:29:26 hatch
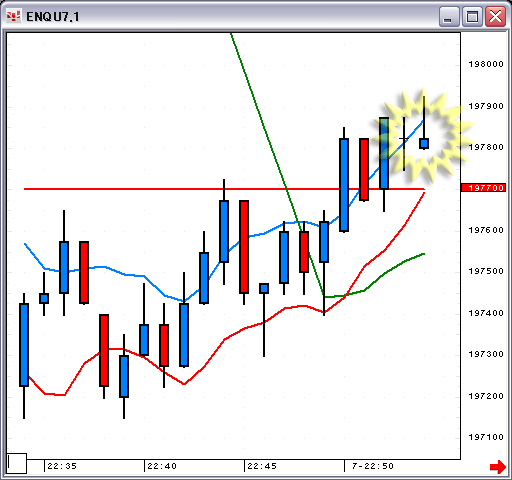
Long at 131.30.
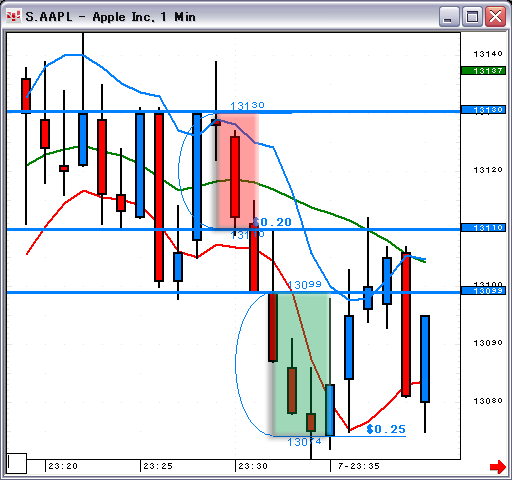
This one did not work out.
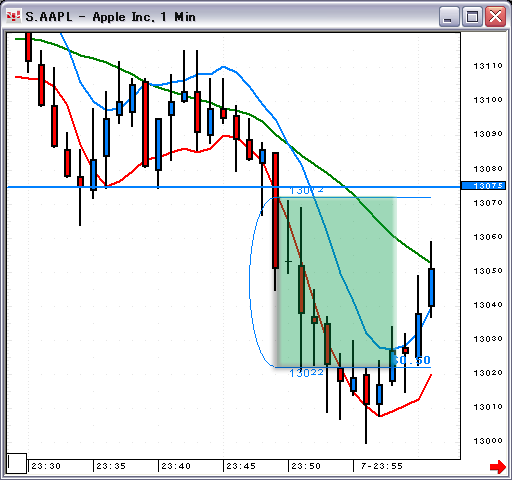
This one is a short trade. (+0.5
point)
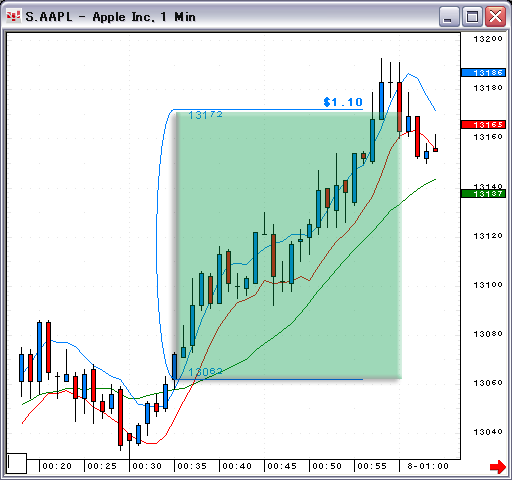
This one gave me 1.1 point gain.
The Nasdaq finished lower.
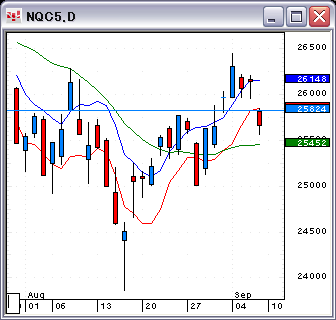
Gapper's Eye Index
Daytradenet Top
Charts courtesy of CQG
Source: 2006 CQG, Inc. All rights reserved worldwide.

Red
and blue zones show the gap of the preceding day.
The Green zone indicates the profitable zone of
trading.