9/12/2007 Wed@@@
Scalping:
RIMM, SHLD, AAPL, CELG, FWLT
and BIDU
Gapper's
Eye utilizes our original unique stock scanner, Break Scan, and sophisticated
chart software, CQG. With nominal fee, the Break Scan is available to our
members.
The Kamikaze Gap Play
was introduced to the U.S. traders in the
August 2005 issue of Active Trader Magazine.
@
The Nasdaq opened lower.
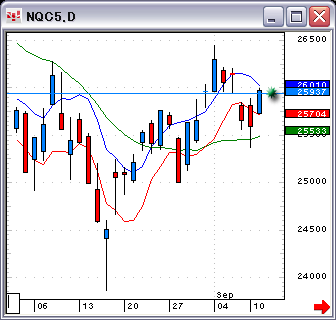
The green dot shows the opening
price.
@
Excerpts from Net Aid:
2007-09-12 22:28:08 hatch shadow
The key is you have to select right stocks to trade. Find strong
stocks, and trade them exclusively.
2007-09-12 22:29:32 hatch shadow
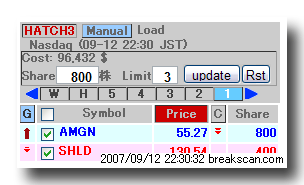
To prevent careless mistakes, make an order screen like this.
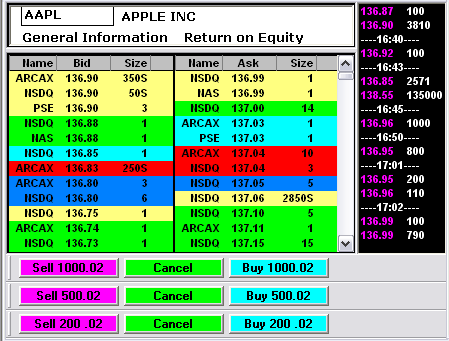
2007-09-12 22:30:29 hatch shadow
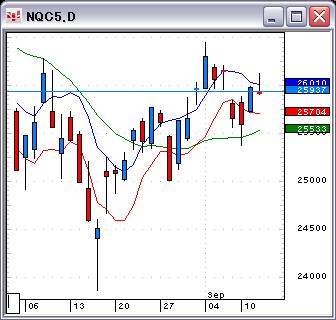
Be aggressive ! The Nasdaq daily chart pattern suggests it's going to
be an up-day.
2007-09-12 22:31:03 hatch shadow
The market has opened.
@
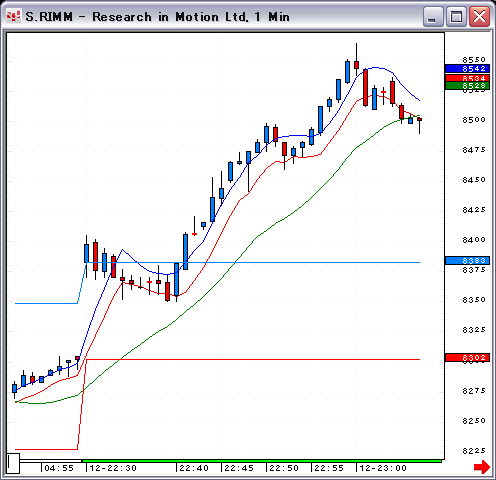
2007-09-12 22:31:32 hatch shadow
qhll
@
2007-09-12 22:31:43 hatch shadow
`lfm@is on tch R.
2007-09-12 22:32:41hatch
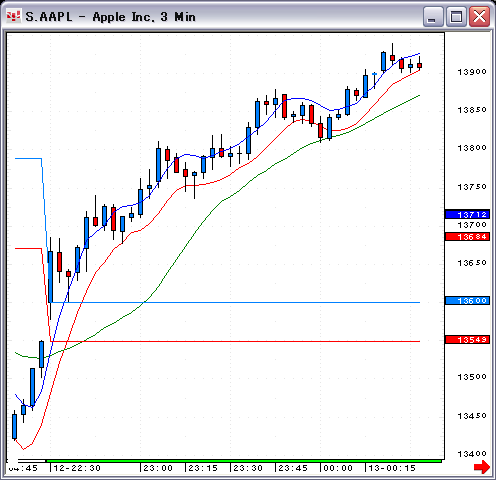
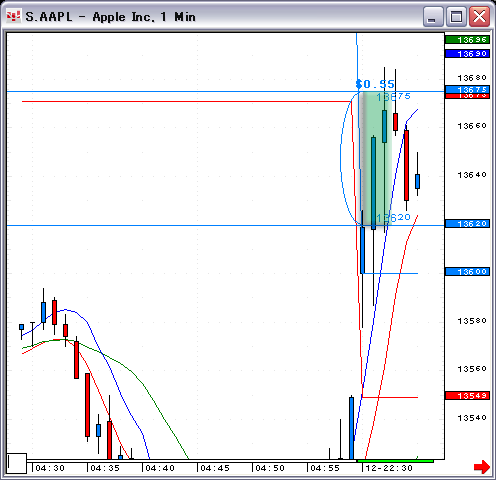
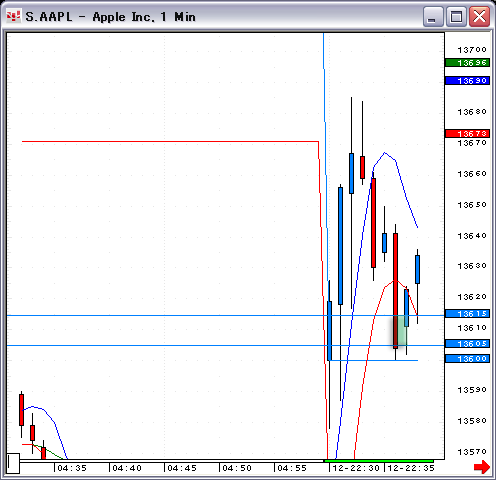
Long AAPL
2007-09-12 22:32:42 ΝΑΏ
long
@
@
2007-09-12 22:33:42 hatch shadow
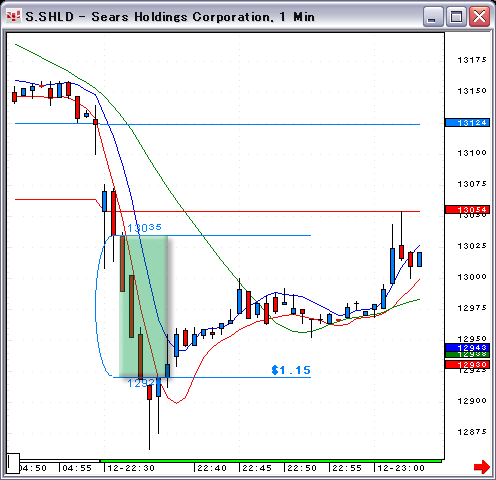
rgkc is breaking down.
2007-09-12 22:33:13 hatch
136.2
2007-09-12 22:34:13 hatch
Out at 136.75.
2007-09-12 22:34:53 hatch
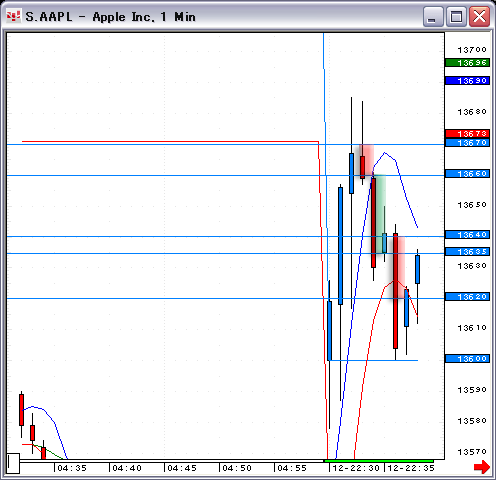
AAPL at 136.70
2007-09-12 22:35:15hatch
Out at 136.60.
2007-09-12 22:35:21 hatch
Short at 136.60.
2007-09-12 22:35:56 hatch shadow
The futures are weak.
@
2007-09-12 22:36:08 hatch
Out at 136.35.
2007-09-12 22:36:19 hatch
Long at 136.40.
2007-09-12 22:37:31 hatch
Out at 136.20.
2007-09-12 22:37:49 hatch
Short at 136.15.
@
2007-09-12 22:38:17 hatch
Out at 136.05
2007-09-12 22:40:05hatch
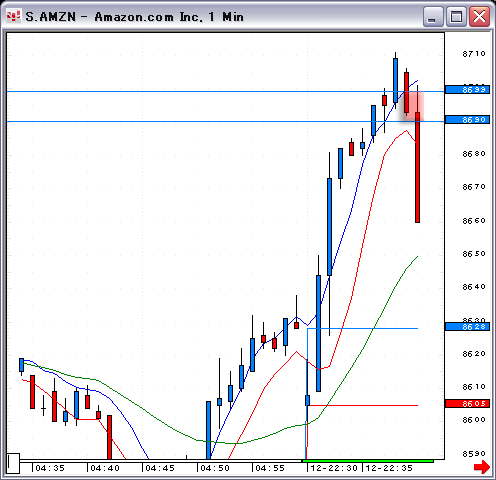
AMZN is strong. Long at 86.99.
2007-09-12 22:42:02 hatch
AMZN out at 86.90.
2007-09-12 22:40:48hatch
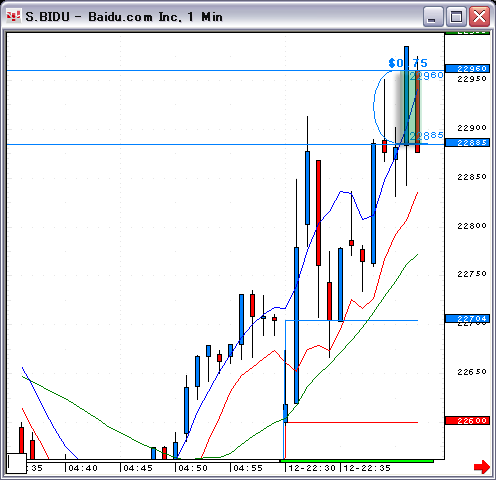
BIDU at 228.85.
2007-09-12 22:43:24 hatch
Out at 229.60.
2007-09-12 22:44:18 hatch
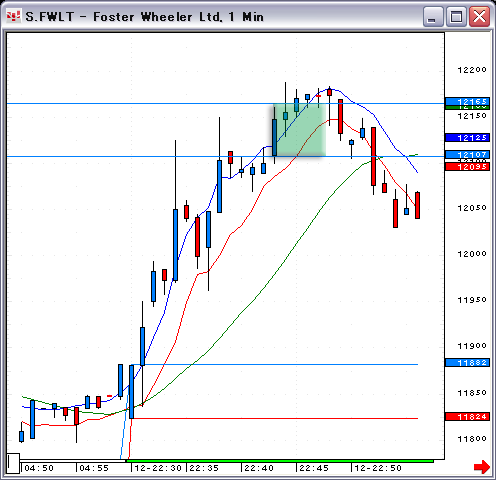
FWLT at 121.07 . The spread is a bit too wide.
2007-09-12 22:49:27 hatch
Out at 121.65.
2007-09-12 22:44:40hatch
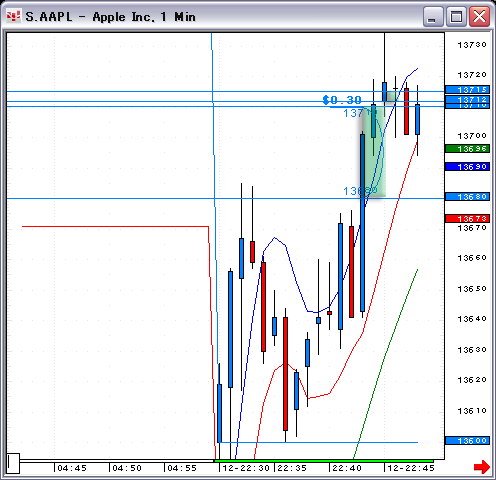
AAPL at 136.80.
2007-09-12 22:47:16 hatch
Out at 137.10.
@
2007-09-12 22:47:57 hatch
Long at 137.12.
2007-09-12 22:48:34 hatch
Out at 137.15.@
2007-09-12 22:50:09 hatch
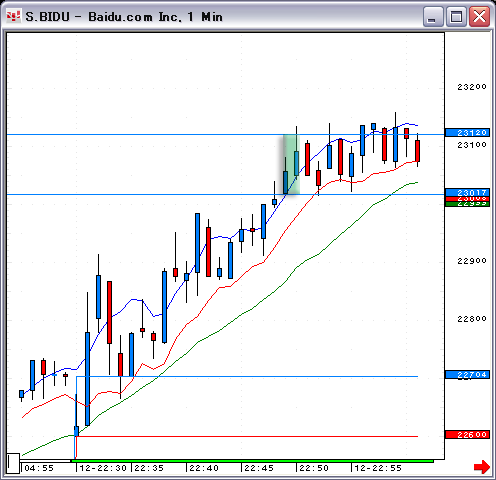
BIDU at 230.17.
2007-09-12 22:51:49 hatch shadow
The futures shows strength.
2007-09-12 22:52:02 hatch
Out at 231.20.
@
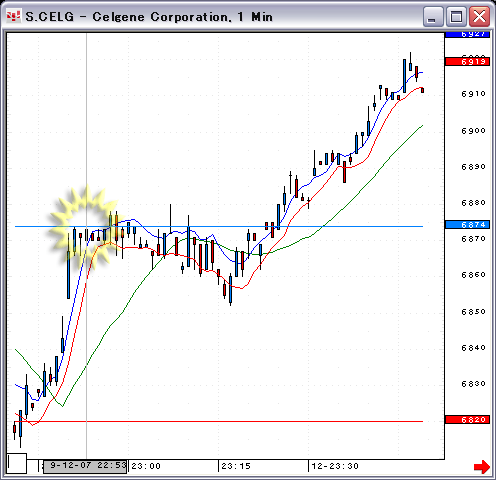
2007-09-12 22:53:16 hatch shadow
bdkf is attempting to take out the gap.
2007-09-12 22:56:21 hatch
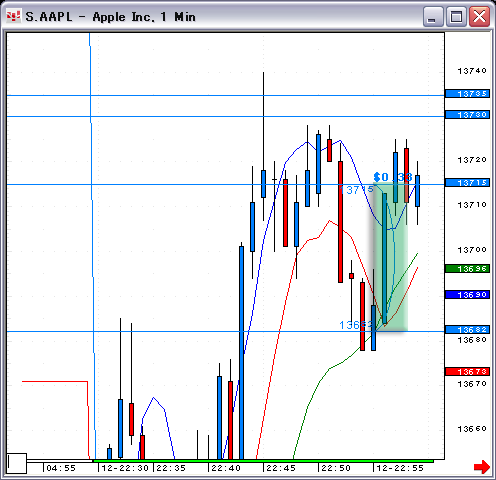
Long AAPL at 136.82.
2007-09-12 22:58:26 hatch
Out at 137.15.
2007-09-12 22:58:51 hatch
Long at 137.15.
2007-09-12 23:02:37 hatch
Out at 137.30.
2007-09-12 23:03:04 hatch
Long at 137.35.
2007-09-12 23:04:14 hatch
Out at 137.50.
2007-09-12 23:04:40 hatch
Long at 137.55.
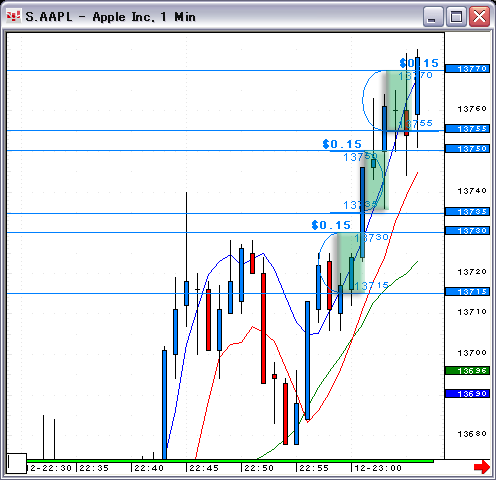
2007-09-12 23:06:26 hatch
Out at 137.70.
@
2007-09-12 23:07:34 hatch
Long at 137.55.
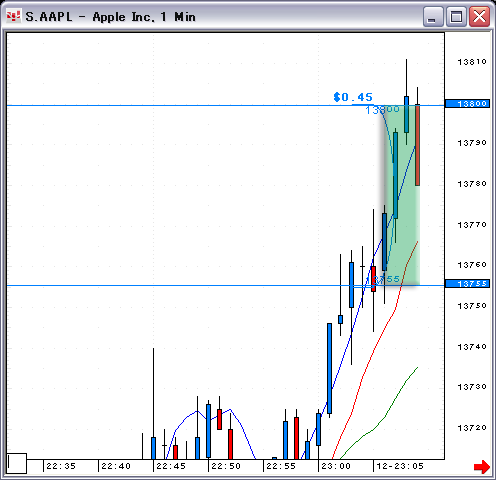
2007-09-12 23:28:01hatch
Out at 138.12.
@
@
The Nasdaq formed a doji-like bar.
Gapper's Eye Index
Daytradenet Top
Charts courtesy of CQG
Source: 2006 CQG, Inc. All rights reserved worldwide.

Red
and blue zones show the gap of the preceding day.
The Green zone indicates the profitable zone of
trading.