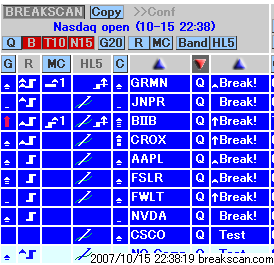
The NASDAQ opened slightly higher.
The green dot indicates the opening price.
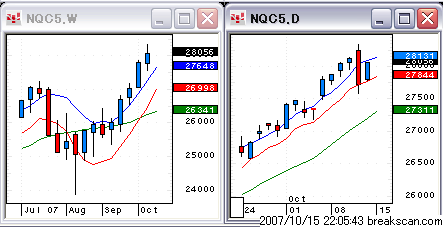
2007-10-15 22:00:51 hatch shadow
Good evening!
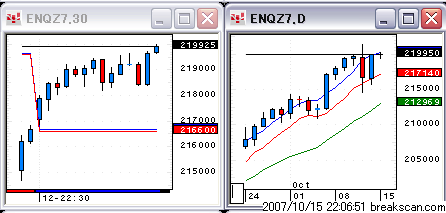
2007-10-15 22:06:50 hatch shadow
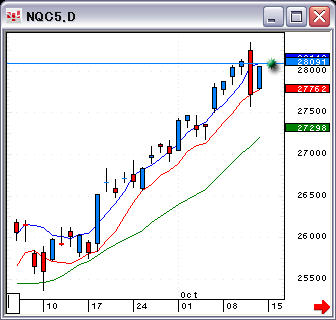
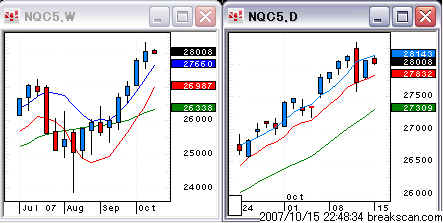
The index was down big last Thursday, but it regained some Friday.
2007-10-15 22:06:59 hatch shadow
The market will open flat today. Here
are the futures charts.
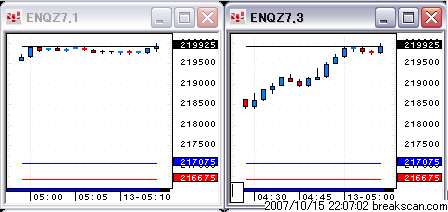
2007-10-15 22:07:14 hatch shadow
These are the 1- and 3-min. charts
2007-10-15 22:30:10 hatch shadow
The market has opened.
2007-10-15 22:30:45 hatch shadow
Let's see...
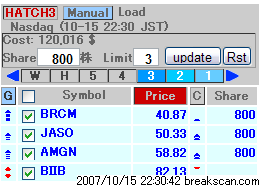
2007-10-15 22:30:55 hatch shadow
This is level 3, hatch 3.
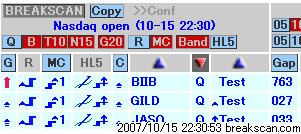
2007-10-15 22:32:40 hatch shadow
AAPL is taking out the high.
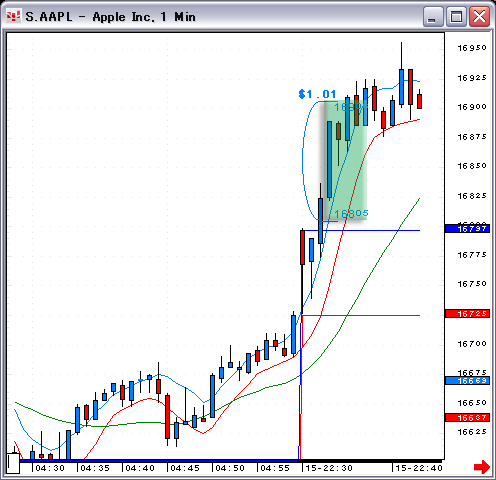
Up $200 for 200 shares. Up $500 for 500 shares.
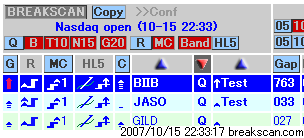
2007-10-15 22:33:24 hatch shadow
BIIB is testing the high.
2007-10-15 22:34:08 hatch shadow
But, BIIB's gap is too huge.
2007-10-15 22:34:54 hatch shadow
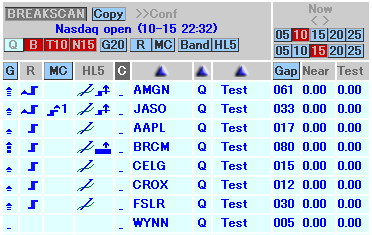
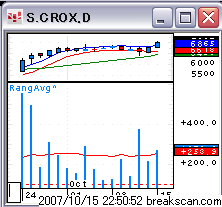
CROX is moving higher.
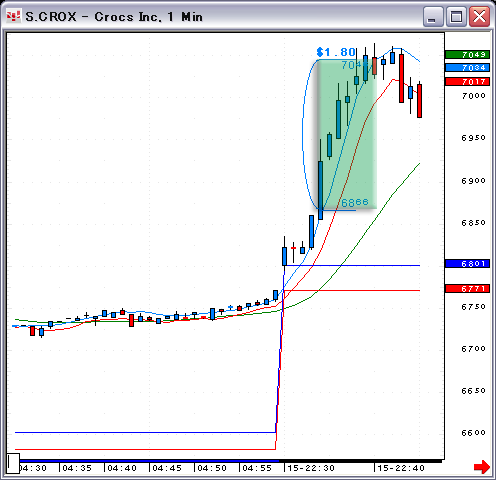
Up $900 for 500 shares.
2007-10-15 22:38:33 hatch shadow
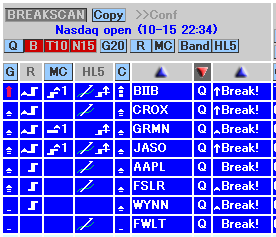
CROX will appear if you remove G20 filter.
2007-10-15 22:48:47 hatch shadow
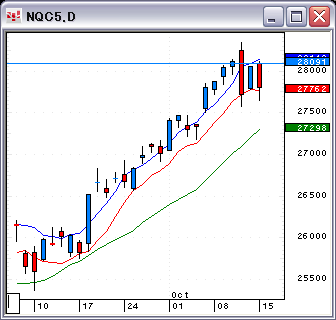
This is how the NASDAQ looks like. It may not go any higher.
2007-10-15 22:51:01 hatch shadow
CROX hit its average daily travel range.
The NASDAQ finished with a down
bar.
Source: 2006 CQG, Inc. All rights reserved worldwide.