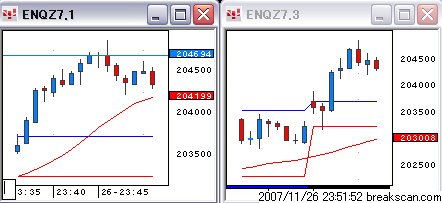
The green dot indicates the opening
price.
2007-11-26 23:00:54 hatch shadow
Good evening.
2007-11-26 23:02:07 hatch shadow
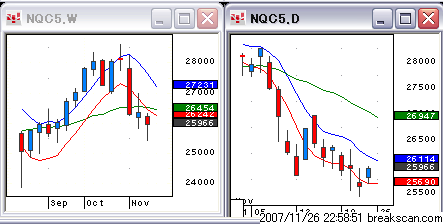
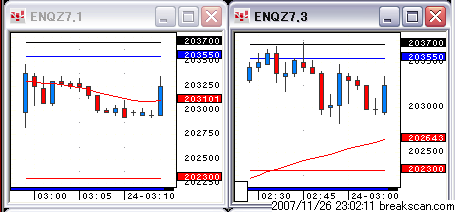
The Nasdaq formed an up bar last Friday.
2007-11-26 23:02:17 hatch shadow
Currently, the futures suggest the somewhat strong open.
2007-11-26 23:03:52 hatch shadow
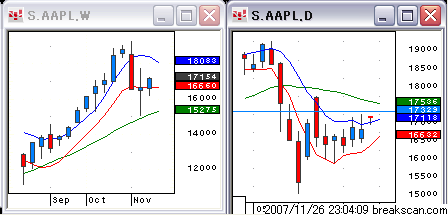
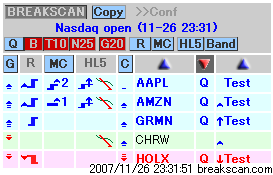
AAPL is making a 5-day high at the open. But, watch out the 20-MA.
2007-11-26 23:05:00 hatch shadow
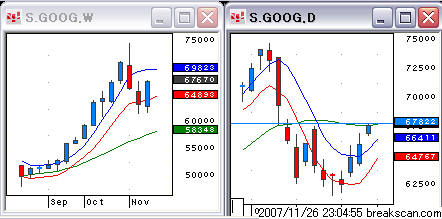
GOOG is opening with a very small upside gap.
2007-11-26 23:05:47 hatch shadow
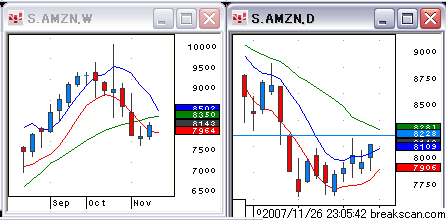
AMZN. This one has already too many consecutive up days.
2007-11-26 23:07:25 hatch shadow
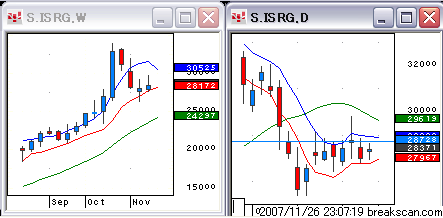
ISRG. This one is questionable.
2007-11-26 23:07:47 hatch shadow
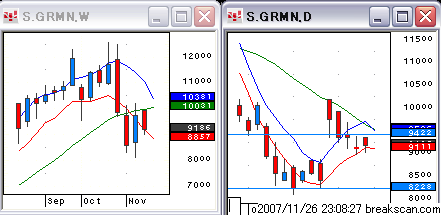
GRMN.
2007-11-26 23:12:35 hatch shadow
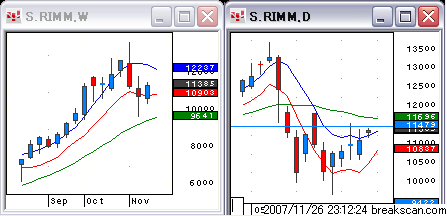
RIMM has a good looking weekly chart.
2007-11-26 23:30:06 hatch shadow
The opening time.
2007-11-26 23:30:17 hatch shadow
Long GOOG.
Broke-even.
2007-11-26 23:30:22 hatch
Long AAPL.
Up $88 for 200 shares.
2007-11-26 23:30:36 hatch shadow
PAYX is on hatch 3.
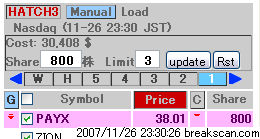
Up $250 for 500 shares
Up $1095 for 500 shares.
2007-11-26 23:32:01 hatch shadow
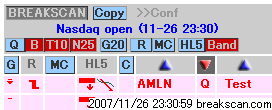
Break Scan Pro
2007-11-26 23:35:20 hatch shadow
FSLR looks ready to move higher.
Up $230 for 100
shares.
2007-11-26 23:36:08 hatch shadow
BIDU
Up $387 for 100 shares.
Up $322 for 100 shares
Up $475 for 500 shares
Up $266 for 200 shares.
Up $383 for 100 shares
2007-11-26 23:40:52 hatch shadow
GOOG looks ready.
2007-11-26 23:46:37 hatch shadow
You can hold BIDU longer.
2007-11-26 23:52:05 hatch shadow
This is it for today.
Up $465 for 50 shares
Up $437 for 100 shares