ü@
2008-01-17
23:00:37 hatch shadow
Good evening.
2008-01-17 23:02:32 hatch shadow
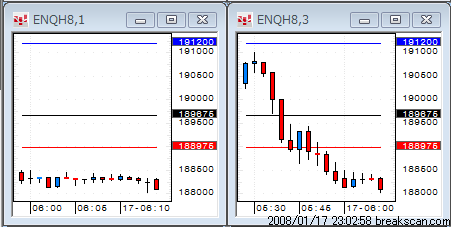
The Nasdaq formed a doji-bar yesterday. Currently, the futures are indicating
the strong open.
2008-01-17 23:04:49 hatch shadow
Many stocks are opening higher, but their charts do not look that
great. But, let me look for a few buy candidates. The first one is
JASO.
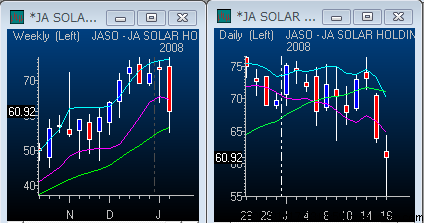
2008-01-17 23:05:19 hatch shadow
It is trading above 20-week MA, and the daily chart looks like
bottomed out.
2008-01-17 23:06:05 hatch shadow
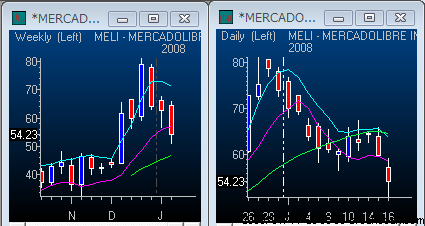
MELI
2008-01-17 23:06:14 hatch shadow
It is up about 0.8 point.
2008-01-17 23:06:17 hatch shadow
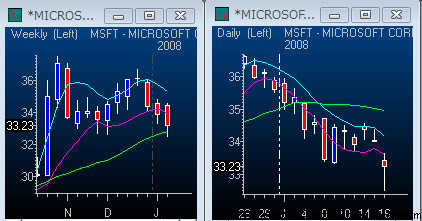
MSFT
2008-01-17 23:06:24 hatch shadow
GILD
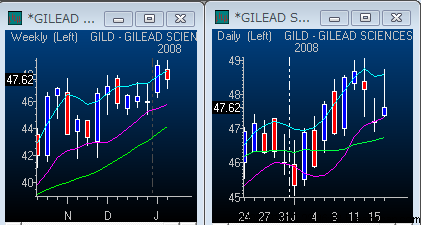
2008-01-17 23:06:34 hatch shadow
This one looks the best so far.
2008-01-17 23:06:42 hatch shadow
CELG
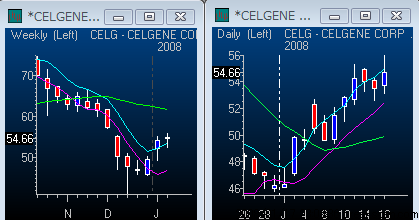
2008-01-17 23:06:51 hatch shadow
Not the weekly, but the daily chart looks fine.
2008-01-17 23:06:58 hatch shadow
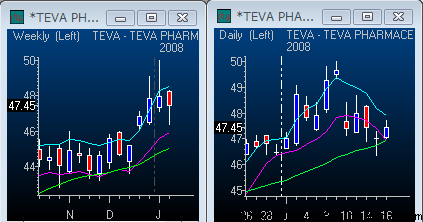
TEVA
2008-01-17 23:07:17 hatch shadow
KLAC
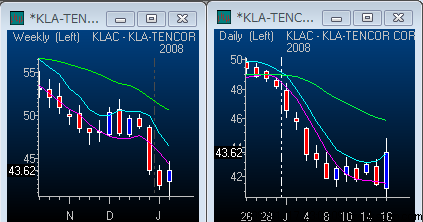
2008-01-17 23:07:26 hatch shadow
It formed an engulfing pattern, but the trend is down.
2008-01-17 23:07:33 hatch shadow
LRCX
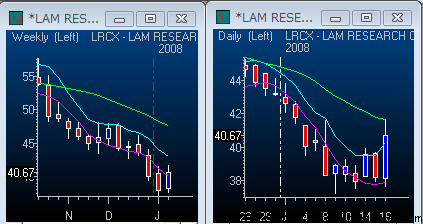
2008-01-17 23:07:37 hatch shadow
The weekly chart pattern does not look good.
2008-01-17 23:07:55 hatch shadow
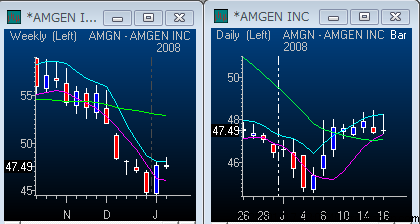
AMGN. The daily chart does not look that bad.
2008-01-17 23:07:57 hatch shadow
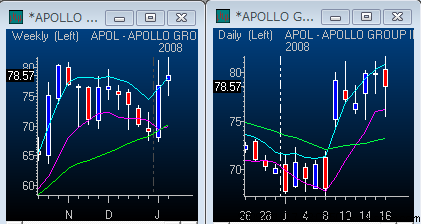
APOL
2008-01-17 23:08:13 hatch shadow
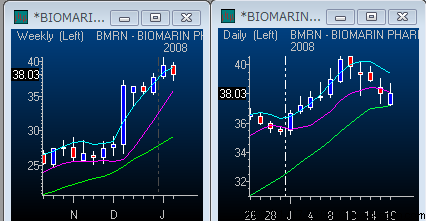
BMRN
2008-01-17 23:08:24 hatch shadow
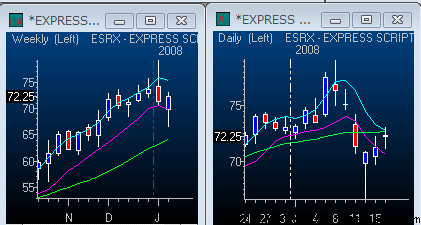
ESRX
2008-01-17 23:08:36 hatch shadow
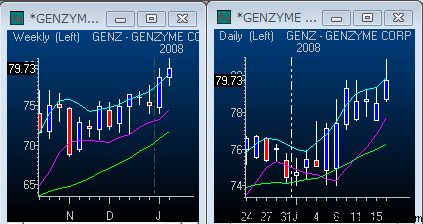
GENZ
2008-01-17 23:08:48 hatch shadow
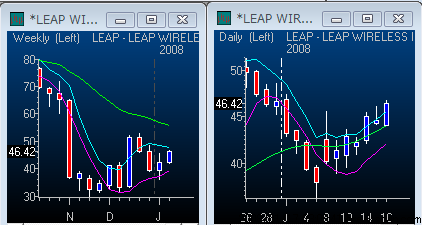
LEAP
2008-01-17 23:09:13 hatch shadow
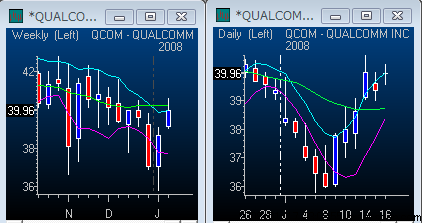
QCOM
2008-01-17 23:09:17 hatch shadow
UAUA
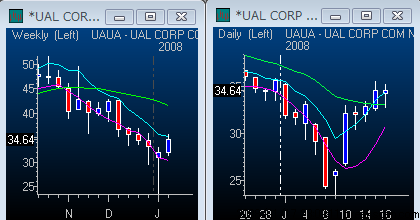
2008-01-17 23:09:24 hatch shadow
The weekly chart does not look good.
2008-01-17 23:09:35 hatch shadow
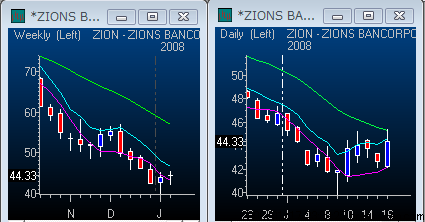
ZION
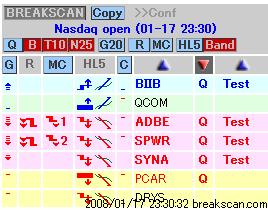
2008-01-17 23:30:09 hatch shadow
The opening bell !
2008-01-17 23:30:22 hatch shadow
ESRX
Up $120 for 200 shares.
I bought the stock as soon as it took out the declining
trendline.
ü@
2008-01-17 23:30:24 hatch shadow
GILD
Up $150 for 500 shares.
I bought the stock as soon as it took out the declining
trendline.
]2008-01-17 23:30:27 hatch shadow
GENZ
Up $160 for 200 shares.
I bought the stock as soon as it took out the declining
trendline.
ü@
2008-01-17 23:30:31 hatch shadow
APOL
up $100 for 200 shares.
2008-01-17 23:30:39 hatch shadow
BMRN
Up $500 for 500 shares.
This, too, was selected before the market.
ü@
ü@
2008-01-17 23:30:59 hatch shadow
BIIB, on Break Scan
Up $310 for 500 shares.
This is trading above the 20-day MA.
ü@
2008-01-17 23:31:18 hatch shadow
TEVA
Broke even.
This stock is trading above the 20-day MA, an uptrending
stock.
2008-01-17 23:31:37 hatch shadow
ISRG
Broke even
2008-01-17 23:31:39 hatch shadow
COST
Up $240 for 500 shares
It reversed to the upside.
ü@
2008-01-17 23:31:46 hatch shadow
FMCN
Down $110 for 500 shares.
This stock is in a downtrend. This trade did not work out
because the overall market was weak. Be
sure to check the trend of the daily chart before you trade.