2008-01-28 23:00:06 hatch shadow
Good evening.
2008-01-28 23:04:59 hatch shadow
The Nasdaq finished with a down bar Friday. Currently the
futures suggest the flat open.
2008-01-28 23:10:41 hatch
shadow
Hard to borrow stocks: DRYS,FMCN,HOLX,SHLD
and SPWR.
2008-01-28 23:13:01 hatch
shadow
MELI has the biggest downside gap.
2008-01-28 23:14:24 hatch
shadow
These are stocks with good daily chart patterns: QCOM,
ACAS, ZION, and UAUA.
2008-01-28 23:15:53 hatch
shadow
NDAQ is iffy.
2008-01-28 23:16:26 hatch
shadow
FAST and BIIB are not that bad at all.
2008-01-28
23:30:00 hatch shadow
The market has opened.
2008-01-28 23:30:54 hatch
shadow
BIIB looks the safest.
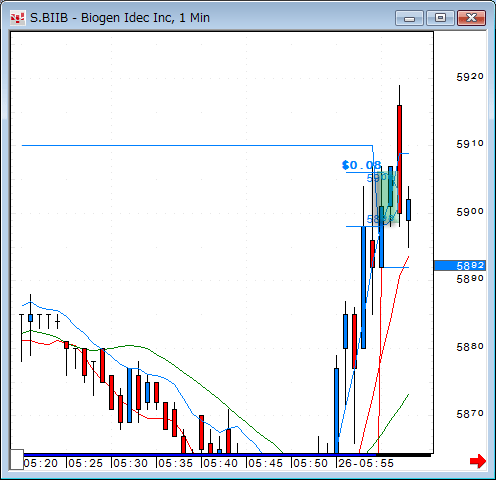
broke even.
2008-01-28 23:31:13 hatch
shadow
QCOM
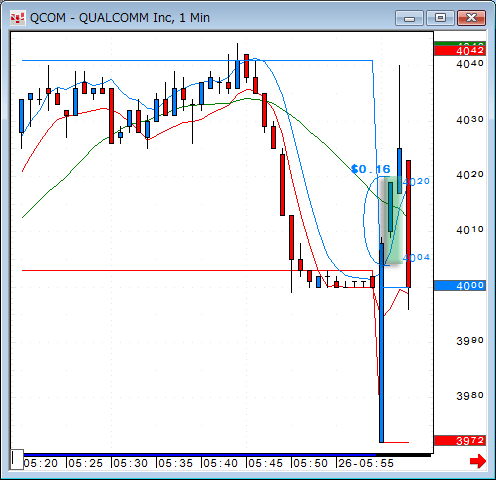
Up $80 for 500 shares.
2008-01-28 23:31:16 hatch
shadow
ACAS
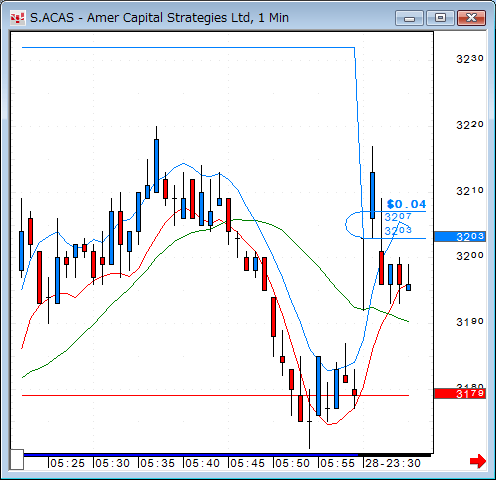
broke even.
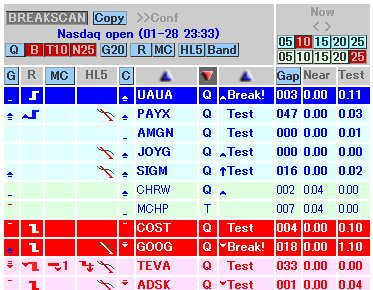
2008-01-28 23:32:39 hatch
shadow
UAUA
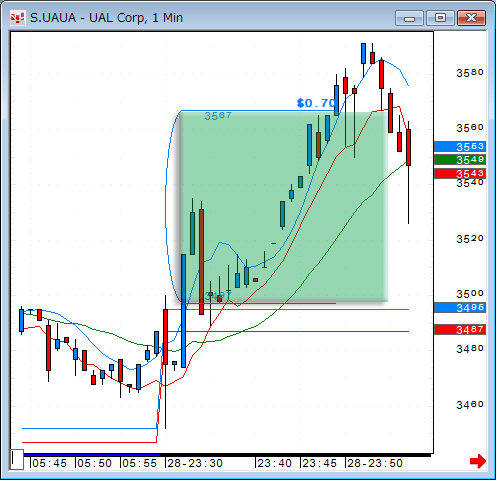
Up $700 for 1000 shares.
2008-01-28 23:33:21 hatch
shadow
AMGN
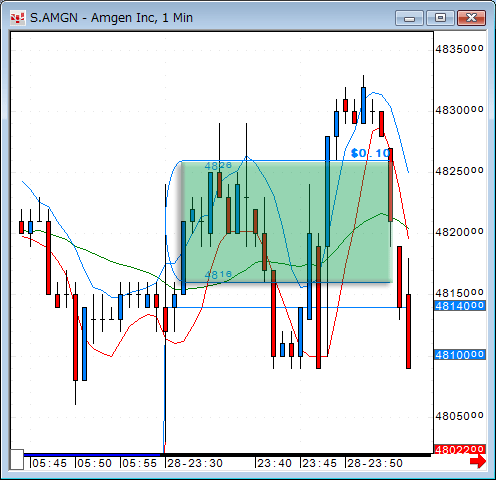
Up $50 for 500 shares.
2008-01-28 23:33:36 hatch
shadow
EXPD.
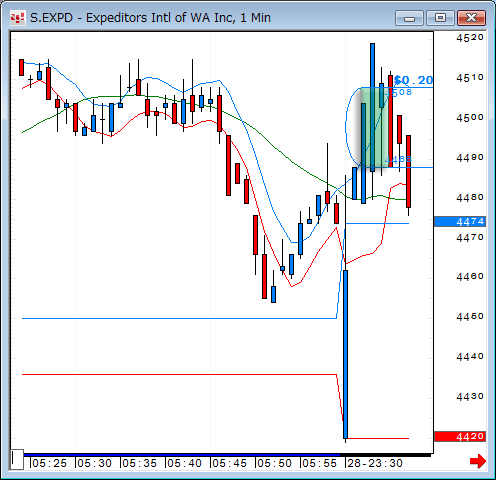
Up $100 for 500 shares.
2008-01-28 23:34:24 hatch
shadow
CHRW
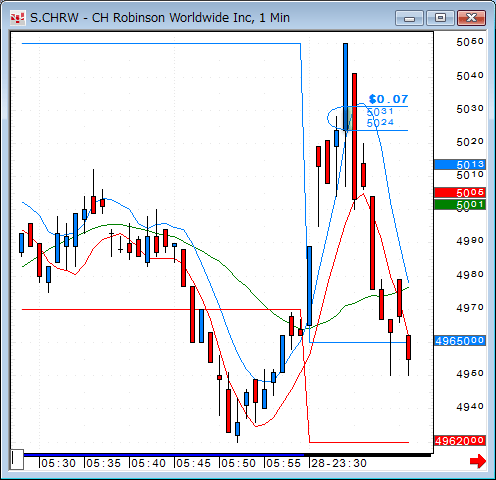
broke even
2008-01-28 23:35:03 hatch
shadow
GOOG
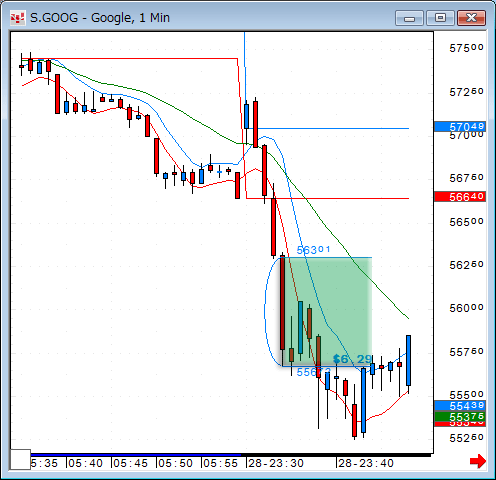
Up $315 for 500 shares.
2008-01-28 23:35:35 hatch shadow
BIDU
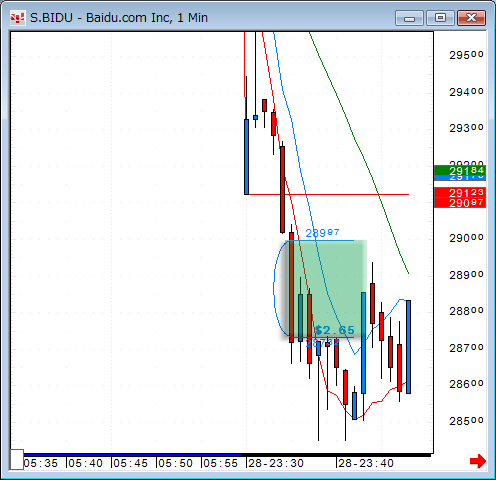
Up $265 for 100 shares
2008-01-28 23:35:56 hatch
shadow
SPWR, a 30-min. gap.
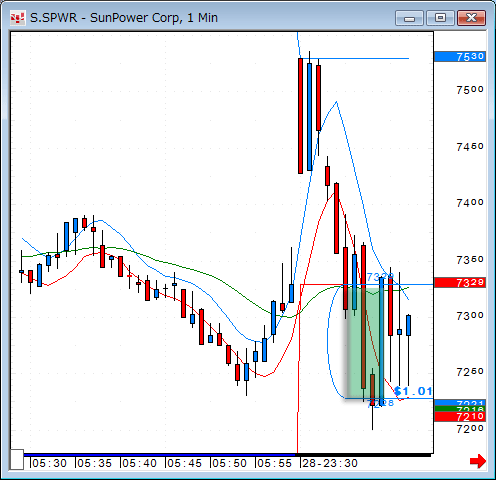
Up $505 for 500 shares.
2008-01-28 23:36:47 hatch
shadow
FMCN
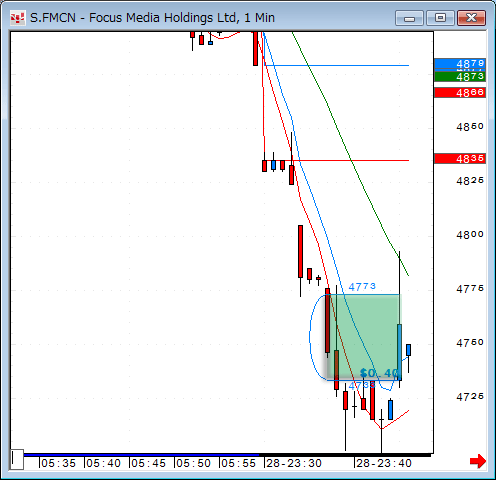
Up $200 for 500 shares.
2008-01-28 23:37:51 hatch
shadow
ISRG.
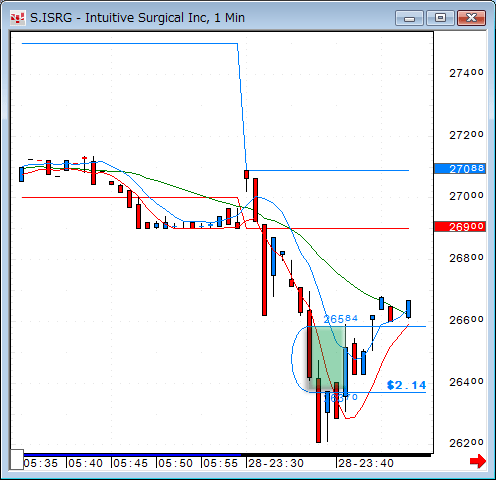
Up $214 for 100 shares.
