2008-02-05 22:59:41 hatch
shadow
Good evening.
2008-02-05
23:06:44 hatch shadow
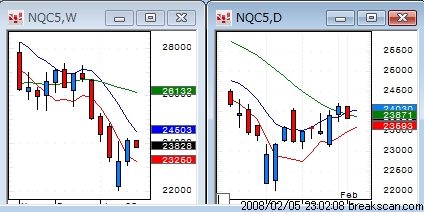
The Nasdaq closed on its 20-day MA yesterday.
2008-02-05
23:06:53 hatch shadow
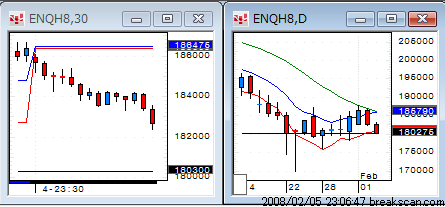
Unfortunately, the futures suggest the lower open.
2008-02-05
23:07:06 hatch shadow
It's a big downside gap.
2008-02-05
23:07:32 hatch shadow
GOOG has the biggest downside gap, a short candidate.
2008-02-05
23:08:29 hatch shadow
ESRX is another short candidate.
2008-02-05
23:09:06 hatch shadow
Long candidates: ILMN, BMRN, BUCY, CTXS, EXPD, FISV, GENZ,
HOLX, INTU, ISRG, and
JBHT.
2008-02-05
23:18:58 hatch shadow
Hard to borrow stocks: DRYS, FMCN, HOLX, SHLD, and SPWR.
2008-02-05
23:30:09 hatch shadow
The market has begun.
2008-02-05
23:32:03 hatch shadow
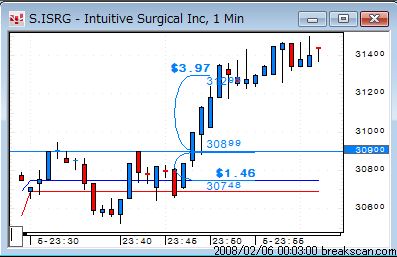
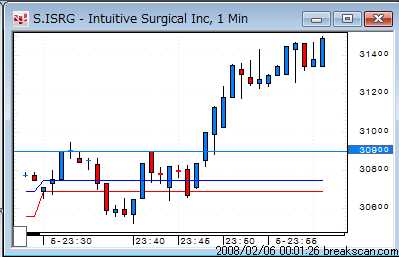
Long ISRG.
Up $150 for 100 shares.
2008-02-05
23:33:15 hatch shadow
ILMN
Up $400 for 500 shares.

2008-02-05
23:35:56 hatch shadow
ADSK and BIDU.
Up $150 for 100 shares.
Up $120 for 1000 shares.
2008-02-05
23:37:31 hatch shadow
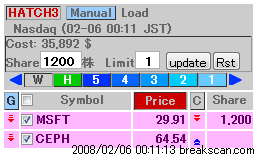
MSFT on hatch 3
2008-02-05
23:37:37 hatch shadow
Short MSFT.
2008-02-05
23:38:11 hatch shadow
Long AAPL.
2008-02-05
23:38:27 hatch shadow
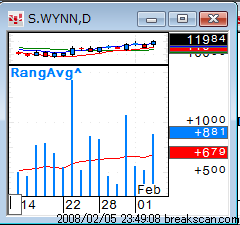
WYNN
2008-02-05
23:42:28 hatch shadow
Exit AAPL.
Up $80 for 200 shares.
2008-02-05
23:43:26 hatch shadow
Exit WYNN.
Up $944 for 200 shares.
2008-02-06
00:01:42 hatch shadow
ISRG
2008-02-06
00:03:01 hatch shadow
Watch out for a reversal.