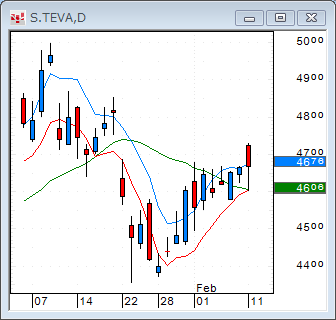
2/11/2008
Mon
Follow the
Trend
DRYS, WYNN
and AKAM
Gapper's
Eye utilizes our original unique stock scanner, Break Scan, and sophisticated
chart software, CQG. With nominal fee, the Break Scan is available to our
members.
The Kamikaze Gap Play
was introduced to the U.S. traders in the
August 2005 issue of Active Trader Magazine.
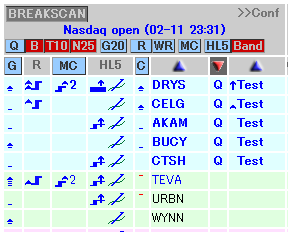
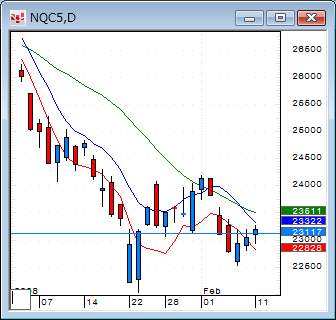
The Nasdaq opened higher.
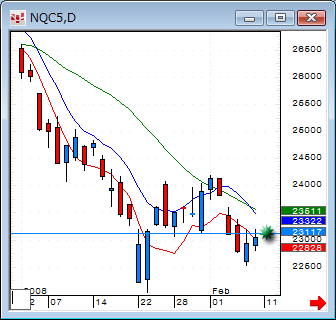
The green dot indicates the opening
price.
Excerpts from Net Aid:
2008-02-11 22:58:45 hatch
Good evening.
2008-02-11 23:05:13 hatch shadow
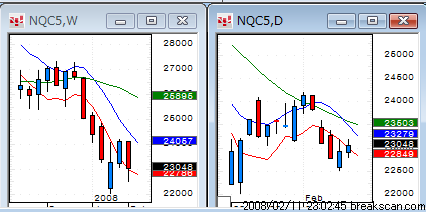
The Nasdaq recorded two straight winning sessions.
2008-02-11 23:05:19 hatch shadow
Currently, the futures are strong.
2008-02-11 23:10:04 hatch shadow
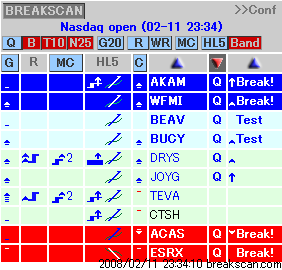
Hard to borrow stocks: ACAS, AMZN, DRYS, FMCN, HOLX, SHLD and SPWR.
2008-02-11 23:17:43 hatch shadow
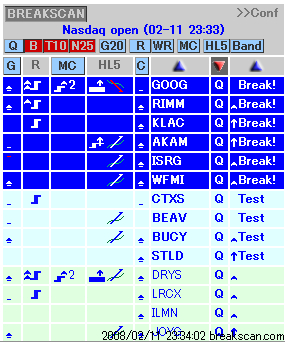
Stocks with upside gaps: FSLR, BIDU, DRYS, WYNN, TEVA and AKAM.
2008-02-11 23:30:12 hatch shadow
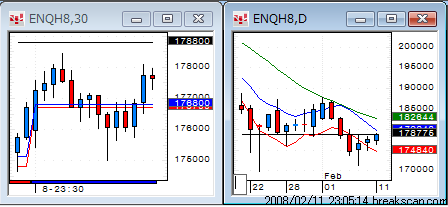
The market has started.
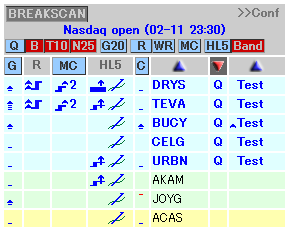
Band indicates stocks with the properly lined up MAs.
WR shows stocks trading above the previous day's resistance and above
a 2-week resistance on the 30-min. charts.
2008-02-11 23:30:24 hatch shadow
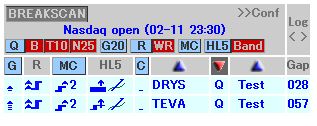
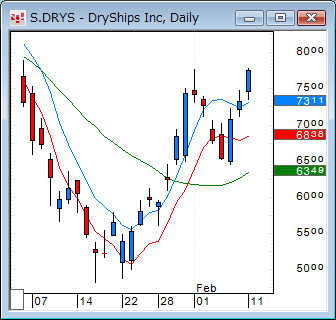
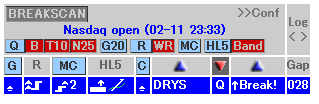
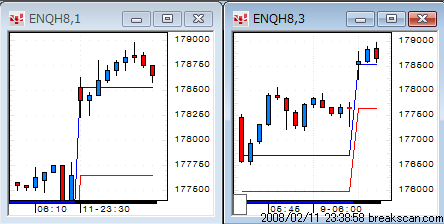
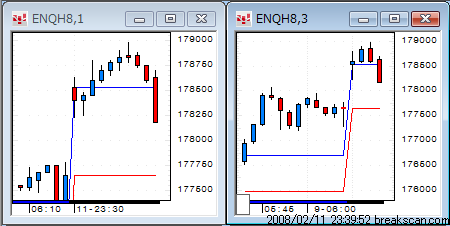
DRYS
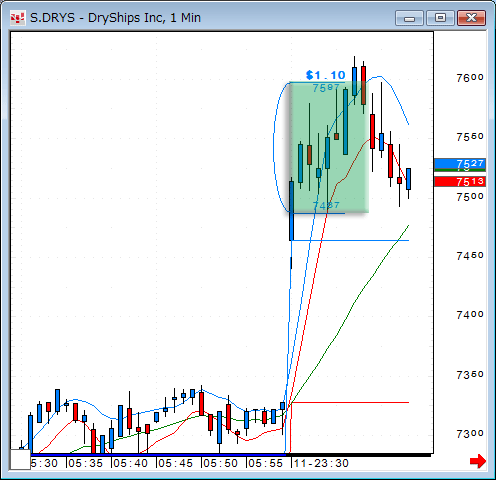
Up $550 for 500 shares.
The resistance is closer compare to DRYS.
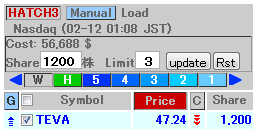
2008-02-11 23:30:26 hatch shadow
TEVA
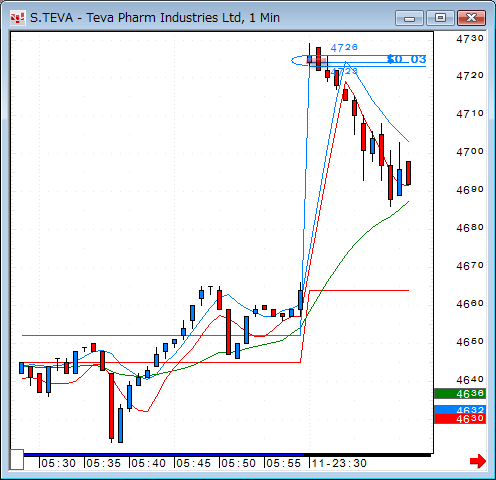
break even.
2008-02-11 23:31:06 hatch shadow
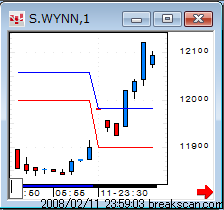
WYNN.
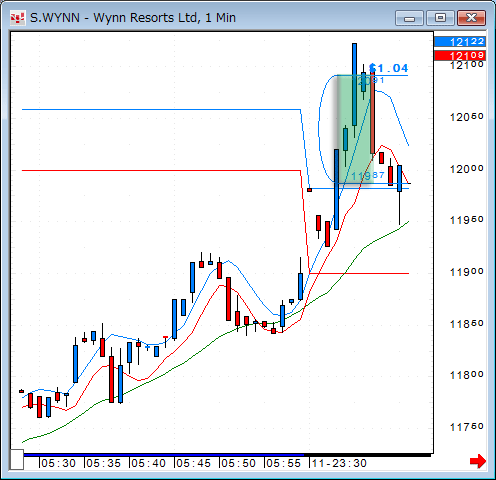
Up $208 for 200 shares.
2008-02-11 23:31:08 hatch shadow
AKAM.
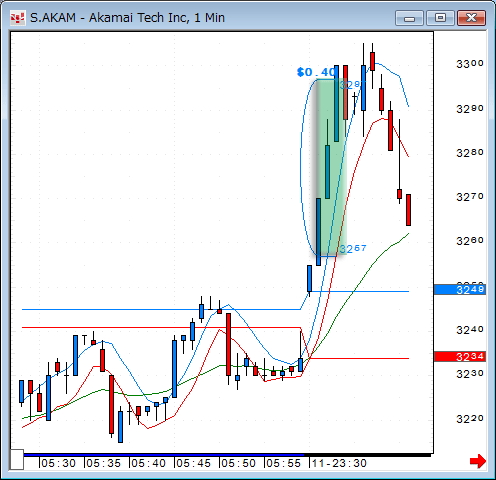
Up $400 for 1000 shares.
Band indicates stocks with the properly lined up MAs.
WR shows stocks trading above the previous day's resistance and above
a 2-week resistance on the 30-min. charts.
2008-02-11 23:37:51 hatch shadow
The futures are losing steam.
2008-02-11 23:43:08 hatch shadow
QCOM does not have good range.
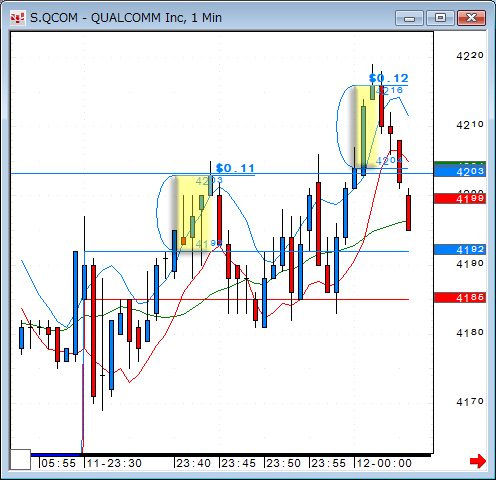
It's not enough gain.
2008-02-11 23:43:11 hatch shadow
RIMM.
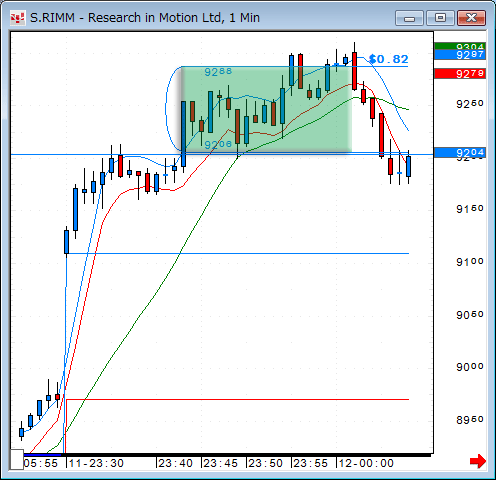
Up $164 for 200 shares.
2008-02-11 23:59:06 hatch shadow
Here's WYNN's chart.
2008-02-12 00:07:57 hatch shadow
The futures are weak.
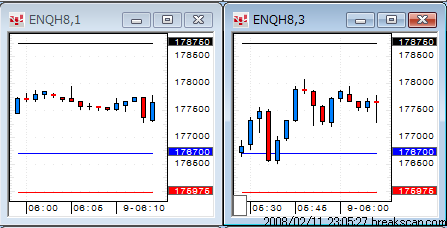
Hatch 3.
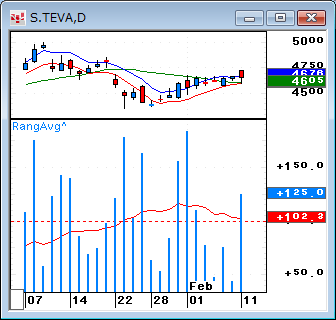
The
average range is 1 point.
The yellow shows the entry point.
It safely went up.
The Nasdaq formed a narrow
range up-bar.
Gapper's Eye Index
Daytradenet Top
Charts courtesy of CQG
Source: 2006 CQG, Inc. All rights reserved worldwide.

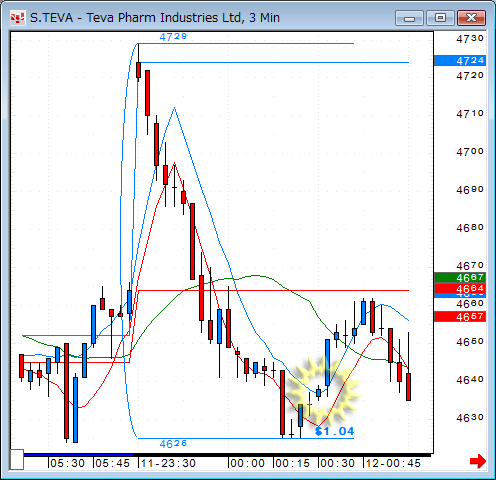
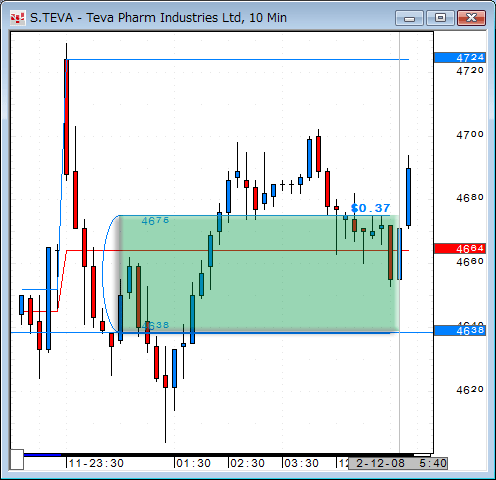
Red
and blue zones show the gap of the preceding day.
The Green zone indicates the profitable zone of
trading.