2/15/2008 Fri
Two Stocks: PCLN and
HANS
Gapper's
Eye utilizes our original unique stock scanner, Break Scan, and sophisticated
chart software, CQG. With nominal fee, the Break Scan is available to our
members.
The Kamikaze Gap Play
was introduced to the U.S. traders in the
August 2005 issue of Active Trader Magazine.
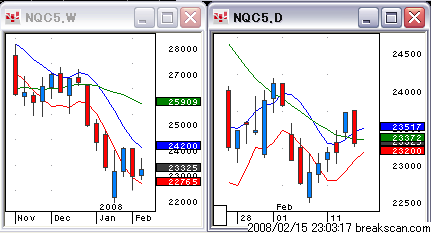
The Nasdaq gapped down on the
open.
The green dot indicates the opening
price.
Excerpts from Net Aid:
2008-02-15 22:59:13 hatch shadow
Good evening.
2008-02-15 23:03:47 hatch shadow
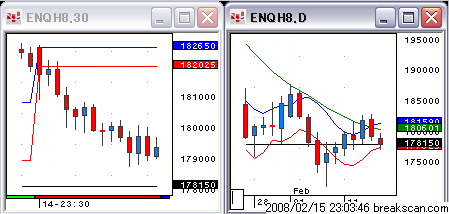
Yesterday, Nasdaq formed a bearish engulfing bar. Currently, the futures
are weak.
2008-02-15 23:04:21 hatch shadow
Obviously, many stocks will be opening lower. But, not many stocks look
attractive to short because of their daily charts.
2008-02-15 23:05:15 hatch shadow
Here are short candidates: GRMN and QCOM.
2008-02-15 23:06:16 hatch shadow
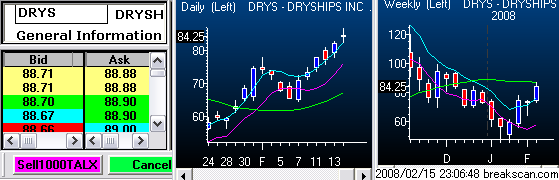
Long candidates: PCLN and DRYS.
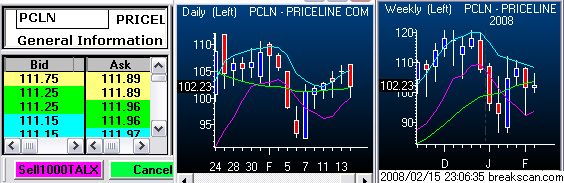
2008-02-15 23:06:50 hatch shadow
Here are charts.
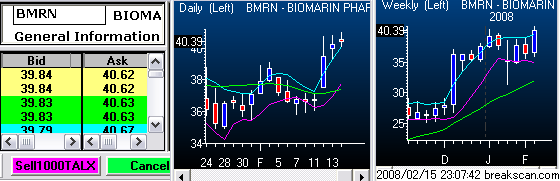
2008-02-15 23:07:59 hatch shadow
BMRN is strongly uptrending.
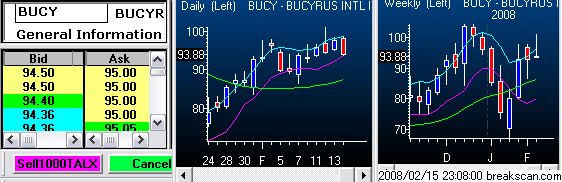
2008-02-15 23:08:09 hatch shadow
BUCY looks good.
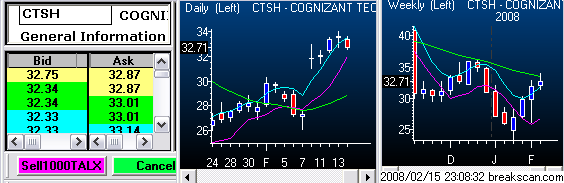
2008-02-15 23:08:46 hatch shadow
CTSH also looks good.
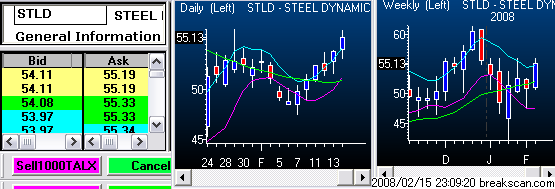
2008-02-15 23:09:30 hatch shadow
So is STLD.
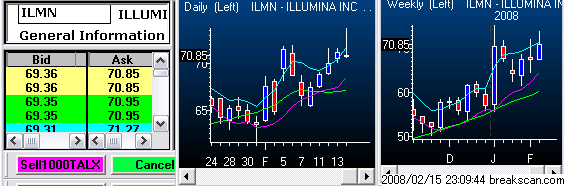
2008-02-15 23:09:57 hatch shadow
ILMN has a long upper tail.
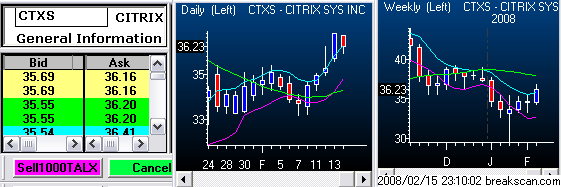
2008-02-15 23:10:22 hatch shadow
CTXS looks promising.
2008-02-15 23:30:10 hatch shadow
The market has begun.
2008-02-15 23:30:26 hatch shadow
Long PCLN.
Up $346 for 200 shares.
2008-02-15 23:31:06 hatch shadow
HANS
Up $690 for 1000 shares.
2008-02-15 23:32:55 hatch shadow
WYNN
Up $346 for 200 shares.
2008-02-15 23:33:07 hatch shadow
AMZN moved below the 20-period MA.
Up $180 for 500 shares.
2008-02-15 23:34:08 hatch shadow
FSLR, a 30-min. pattern.
Up $209 for 100 shares.
2008-02-15 23:35:35 hatch shadow
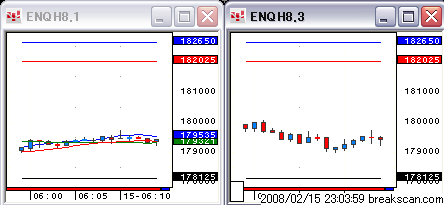
DRYS is on hatch 3.
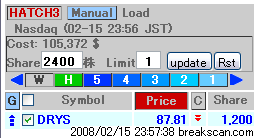
2008-02-15 23:36:59 hatch shadow
Buy DRYS ( bought after three consecutive down bars.)
2008-02-15 23:38:21 hatch shadow
PCLN is showing strength.
Up $1030 for 200 shares.
The Nasdaq shaped a doji-bar.
Gapper's Eye Index
Daytradenet Top
Charts courtesy of CQG
Source: 2006 CQG, Inc. All rights reserved worldwide.

Red
and blue zones show the gap of the preceding day.
The Green zone indicates the profitable zone of
trading.