3/5/2008 Wed
COST: Double Profits
Gapper's
Eye utilizes our original unique stock scanner, Break Scan, and sophisticated
chart software, CQG. With nominal fee, the Break Scan is available to our
members.
The Kamikaze Gap Play
was introduced to the U.S. traders in the
August 2005 issue of Active Trader Magazine.
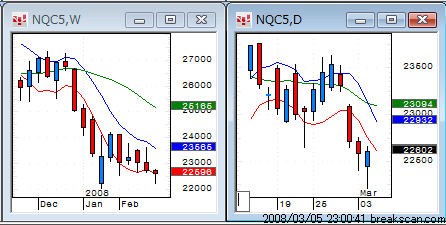
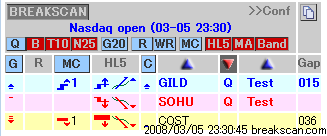
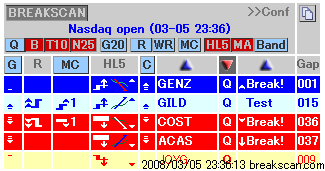
The Nasdaq gapped up on the
open.
The green dot indicates the opening
price.
Excerpts from Net Aid:
2008-03-05 23:02:15 hatch
The Nasdaq formed a long tail yesterday.
2008-03-05 23:03:20 hatch
The futures are strong.
2008-03-05 23:05:50 hatch
Long candidates are:
2008-03-05 23:05:56 hatch
GILD
2008-03-05 23:06:07 hatch
STLD
2008-03-05 23:06:16 hatch
TEVA
2008-03-05 23:08:36 hatch
BUCY
2008-03-05 23:08:43 hatch
CELG
2008-03-05 23:09:07 hatch
GENZ
2008-03-05 23:09:18 hatch
ILMN
2008-03-05 23:09:31 hatch
MCHP
2008-03-05 23:20:00 hatch shadow
Short candidates are: UAUA, COST,
JOYG and SOHU.
2008-03-05 23:30:09 hatch shadow
The market has opened.
2008-03-05 23:30:19 hatch shadow
Long CELG.
Up $120 for 500 shares.
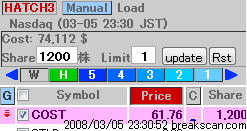
2008-03-05 23:30:37 hatch shadow
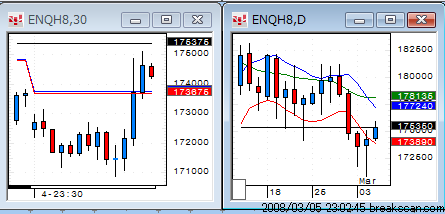
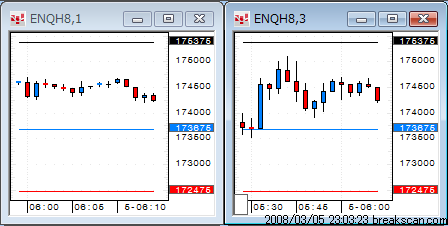
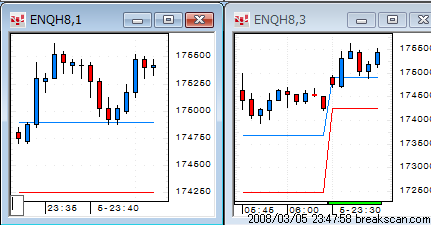
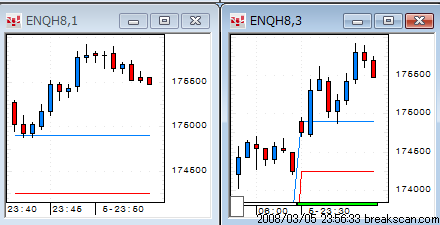
COST is shown on hatch 3.
2008-03-05 23:30:46 hatch shadow
Long BUCY.
Up $308 for 200 shares.
2008-03-05 23:30:56 hatch shadow
GILD.
Up $140 for 500 shares.
2008-03-05 23:34:26 hatch shadow
Short COST here.
A 30-min. gap pattern
2008-03-05 23:35:38 hatch shadow
STLD
Up $755 for 500 shares.
2008-03-05 23:36:33 hatch shadow
COST and ACAS are short prospects.
2008-03-05 23:45:14 hatch shadow
AKAM
Up $1238 for 1200 shares
- hatch shadow
- COST moves about 1.7 point a
day.
Up $1236 for 1200 shares
Up $250 for 1000 shares.
Up $275 for 500 shares.
-
-
Short near the open price.
-
Up $1008 for 1200 shares.
The index finished with an up
bar.
Gapper's Eye Index
Daytradenet Top
Charts courtesy of CQG
Source: 2006 CQG, Inc. All rights reserved worldwide.

Red
and blue zones show the gap of the preceding day.
The Green zone indicates the profitable zone of trading.