3/18/2008 Tue
Rate Cut Expectation
Created The Strong Opening Hour
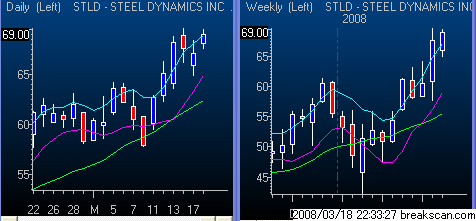
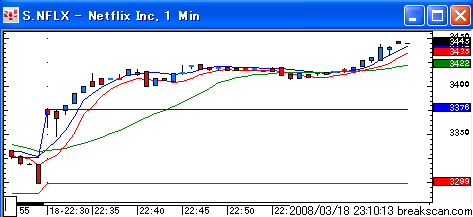
MCHP, STLD and NFLX
Gapper's
Eye utilizes our original unique stock scanner, Break Scan, and sophisticated
chart software, CQG. With nominal fee, the Break Scan is available to our
members.
The Kamikaze Gap Play
was introduced to the U.S. traders in the
August 2005 issue of Active Trader Magazine.
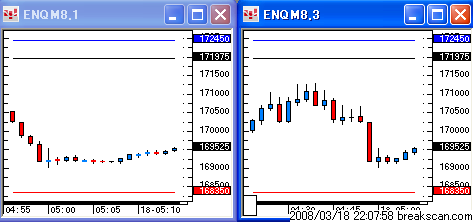
The Nasdaq gapped up on the
open.
The green dot indicates the opening
price.
Excerpts from Net Aid:
2008-03-18 22:07:49 hatch shadow
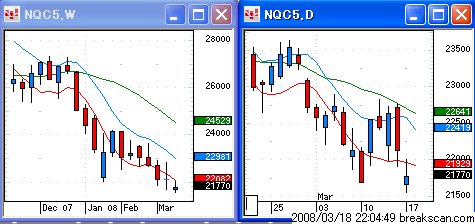
Yesterday, the Nasdaq formed a narrow range up bar.
2008-03-18 22:08:08 hatch shadow
Currently the futures are strong, suggesting the gap-up open.
2008-03-18 22:08:26 hatch shadow
Long candidates are: MCHP, PCAR, ADSK, FAST, NFLX, SIAL and STLD.
2008-03-18 22:11:13 hatch shadow
We will focus on hatch 3 stocks. If no stocks are indicated, we will use
Breakscan.
2008-03-18 22:18:50 hatch shadow
We are not going to hold the stock till the close because of the FOMC.
2008-03-18 22:30:11 hatch shadow
The market has opened.
NFLX, MCHP and STLD are in uptrtends. (See MA)
2008-03-18 22:31:13 hatch shadow
MCHP
Up $120 for 1000 shares.
The rate cuts and the stock surges.
2008-03-18 22:31:21 hatch shadow
STLD
Up $690 for 500 shares.
2008-03-18 22:31:40 hatch shadow
No stocks on hatch 3.
2008-03-18 22:31:48 hatch shadow
None
2008-03-18 22:31:58 hatch shadow
Watch MCHP and STLD.
2008-03-18 22:33:35 hatch shadow
Good chart patterns.
2008-03-18 22:34:39 hatch shadow
NFLX on Breakscan
Up $220 for 1000 shares.
2008-03-18 22:51:07 hatch shadow
BUCY
Up $302 for 200 shares
2008-03-18 23:08:03 hatch shadow
NFLX is breaking out again.
From CNN Money.com : Dow spikes 420
points on rate cut
From MSNBC: Fed cuts key rates three-quarters of a point
The market exploded on the rate cut.
The Nasdaq formed a wide range
up bar.
It's nearing the 20-day MA.
Gapper's Eye Index
Daytradenet Top
Charts courtesy of CQG
Source: 2006 CQG, Inc. All rights reserved worldwide.

Red
and blue zones show the gap of the preceding day.
The Green zone indicates the profitable zone of trading.